Fig. 2.
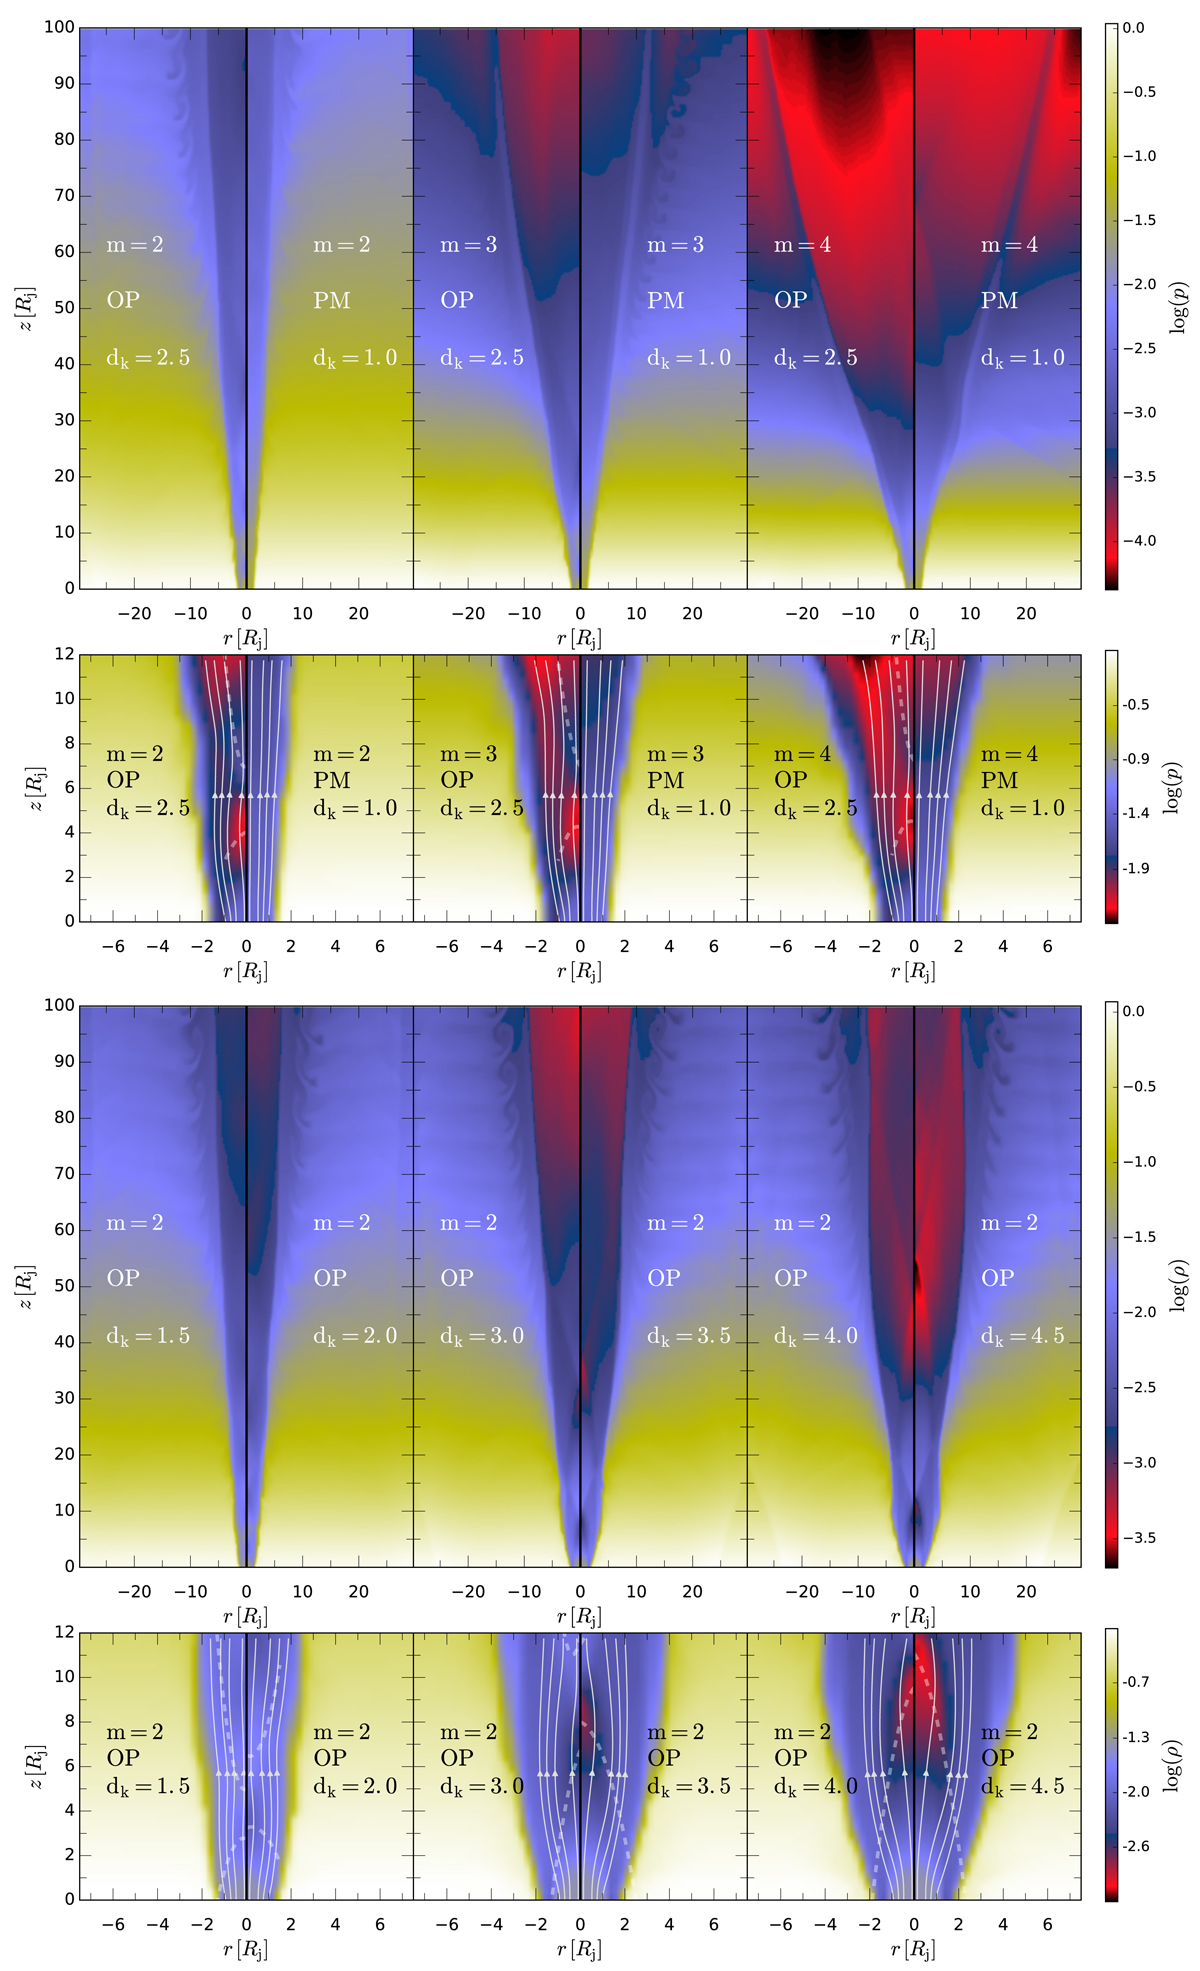
Stationary results for the jet simulations. The panels show the 2D distribution of the rest-mass density for different ambient medium configurations as indicated by the exponent m and dk (dk = 1 corresponds to a PM jet and dk > 1 to an OP jet). The upper row spans the entire simulation grid whereas the bottom row shows a magnified view of the nozzle region (−7 < z/Rj < 7). The white lines in the bottom row show stream lines visualising the direction of the flow and the bold dashed lines correspond to the inward travelling and reflected shock wave.
Current usage metrics show cumulative count of Article Views (full-text article views including HTML views, PDF and ePub downloads, according to the available data) and Abstracts Views on Vision4Press platform.
Data correspond to usage on the plateform after 2015. The current usage metrics is available 48-96 hours after online publication and is updated daily on week days.
Initial download of the metrics may take a while.