Fig. 14.
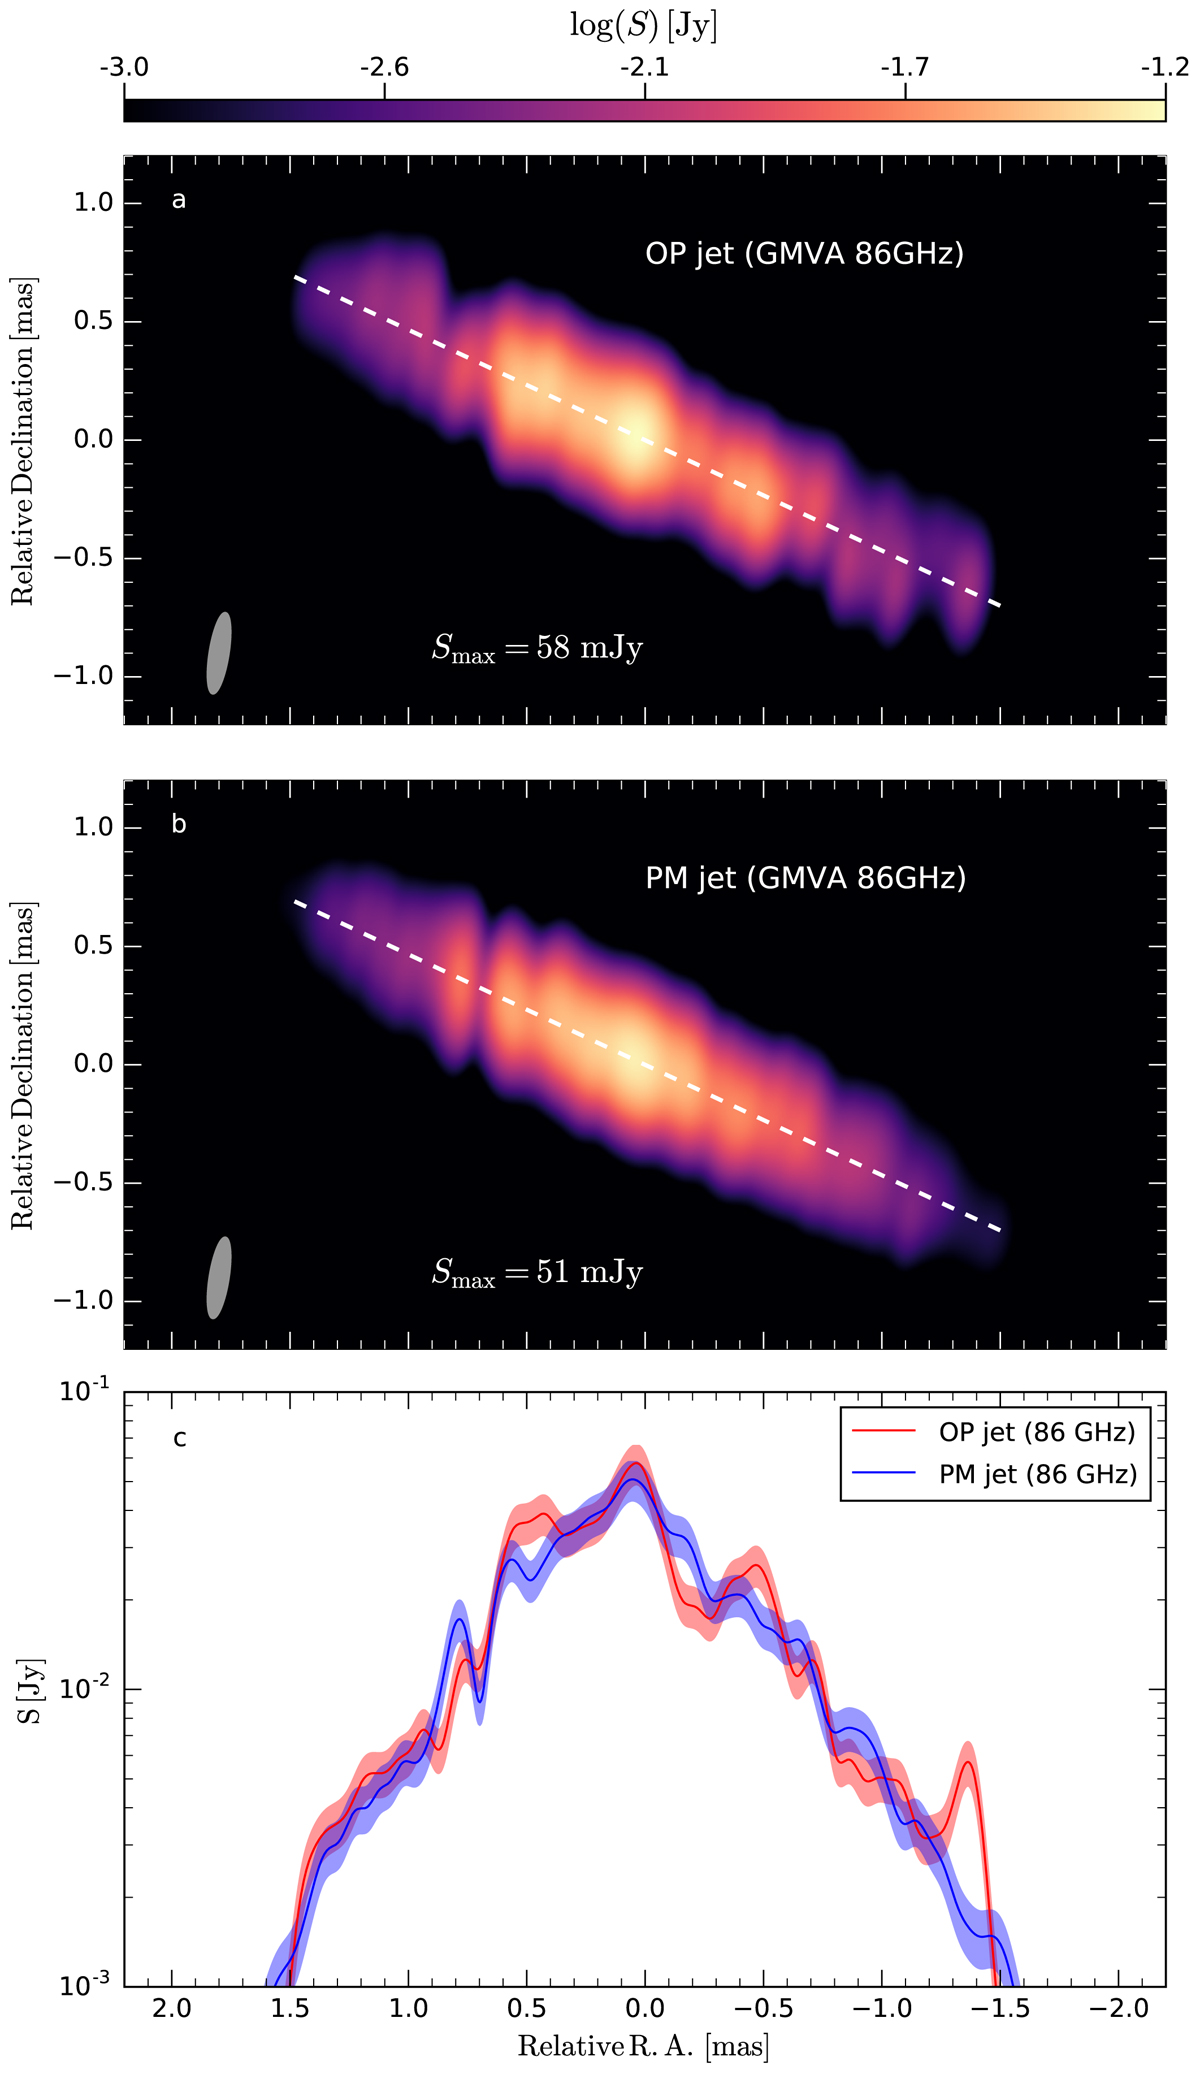
Synthetic radio images for NGC 1052 as seen by the GMVA (panels a and b) at 86 GHz. The OP jet is presented in panel a and the PM jet in panel b. The convolving beam, 345 μas × 82 μas, is plotted in the lower right corner. The flux density along the jet axis, white dashed line in panels a and b is shown in panel c. See text and Appendix A for details of the observation schedule and the array settings.
Current usage metrics show cumulative count of Article Views (full-text article views including HTML views, PDF and ePub downloads, according to the available data) and Abstracts Views on Vision4Press platform.
Data correspond to usage on the plateform after 2015. The current usage metrics is available 48-96 hours after online publication and is updated daily on week days.
Initial download of the metrics may take a while.