Fig. 12.
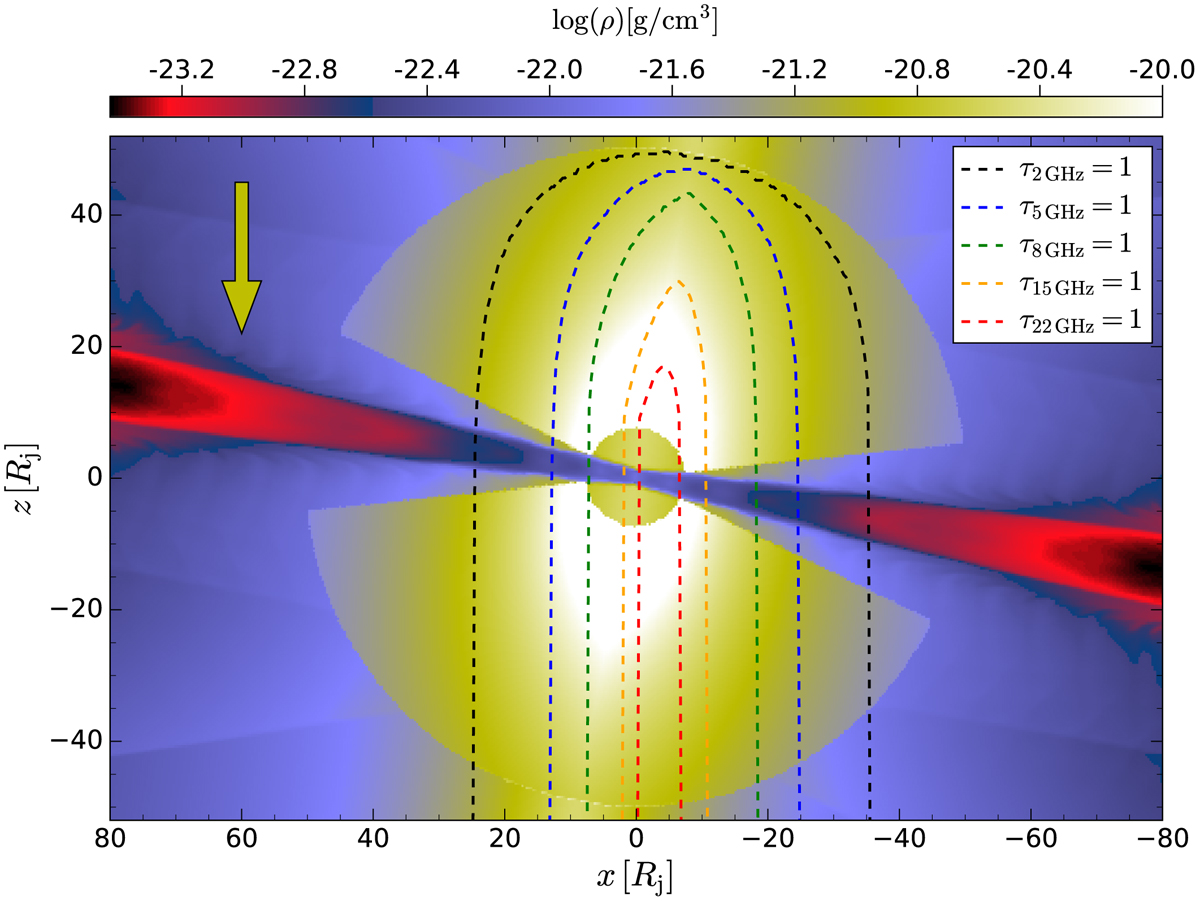
Distribution of the rest mass density for the OP jet in the z-x plane at y = 0. The dashed lines trace the τ = 1 surfaces for 2 GHz, 5 GHz, 8 GHz, 15 GHz and 22 GHz. The yellow arrow indicates the direction of the ray-tracing and regions of the jet within the dashed area are obscured by the torus and not visible in the corresponding radio images.
Current usage metrics show cumulative count of Article Views (full-text article views including HTML views, PDF and ePub downloads, according to the available data) and Abstracts Views on Vision4Press platform.
Data correspond to usage on the plateform after 2015. The current usage metrics is available 48-96 hours after online publication and is updated daily on week days.
Initial download of the metrics may take a while.