Fig. 10.
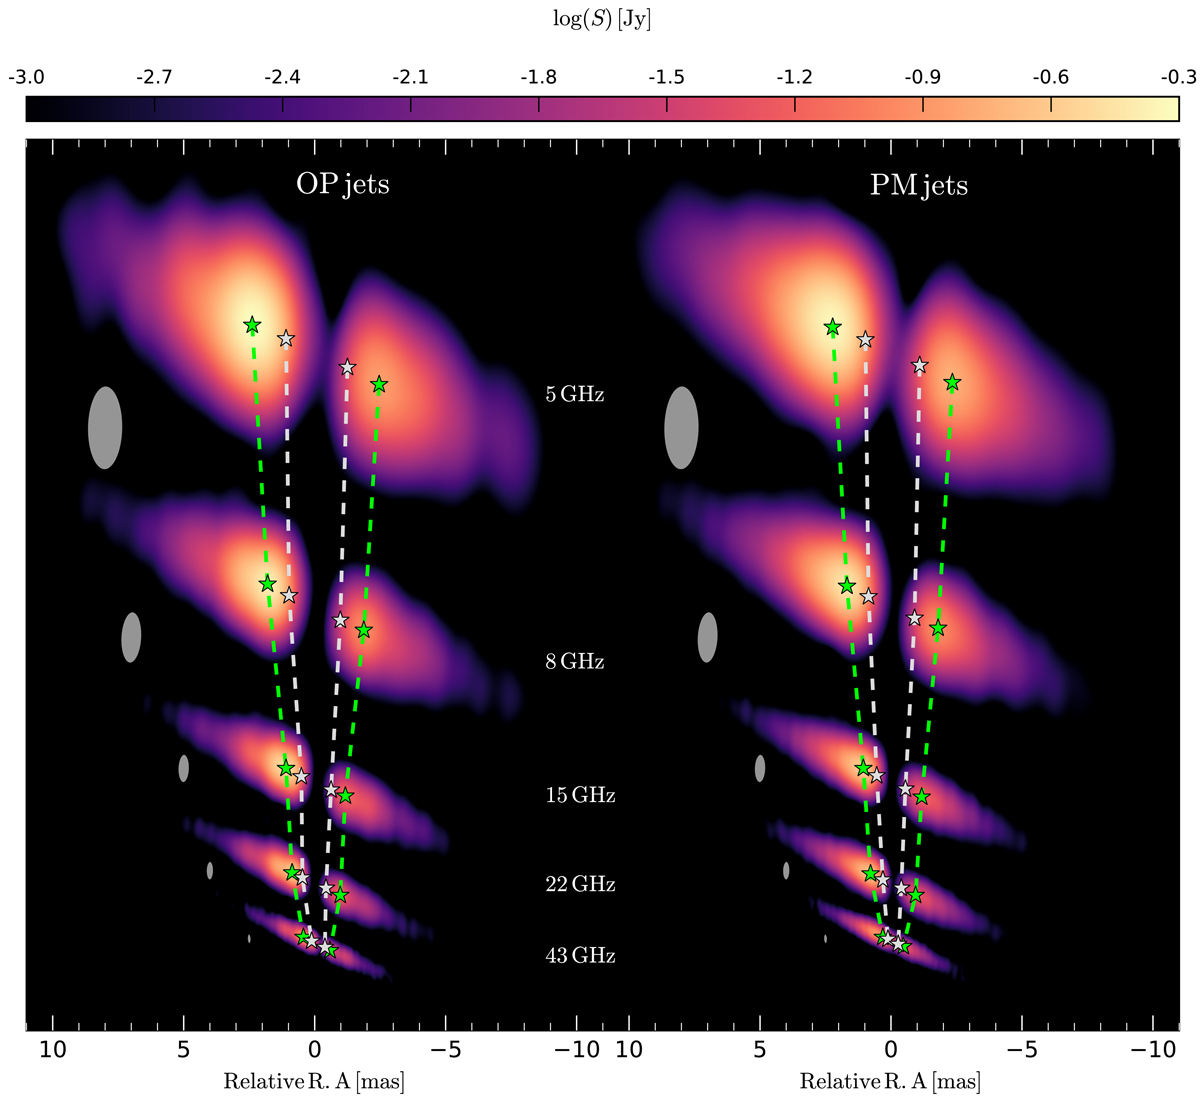
Synthetic multi-frequency VLBA images from 5 GHz towards 43 GHz computed for the OP jet model (left) and the PM jet model (right). The images are aligned by the centre of the emission gap and in all images the lowest flux density plotted is 1 mJy. The convolving beam is plotted next to the radio images. The green stars mark the position of the flux density maximum and the white stars correspond to the position where the flux density reaches 20% of the peak flux density for the first time. The dashed lines trace the position of the aforementioned locations through the multi-frequency radio images.
Current usage metrics show cumulative count of Article Views (full-text article views including HTML views, PDF and ePub downloads, according to the available data) and Abstracts Views on Vision4Press platform.
Data correspond to usage on the plateform after 2015. The current usage metrics is available 48-96 hours after online publication and is updated daily on week days.
Initial download of the metrics may take a while.