Fig. 9
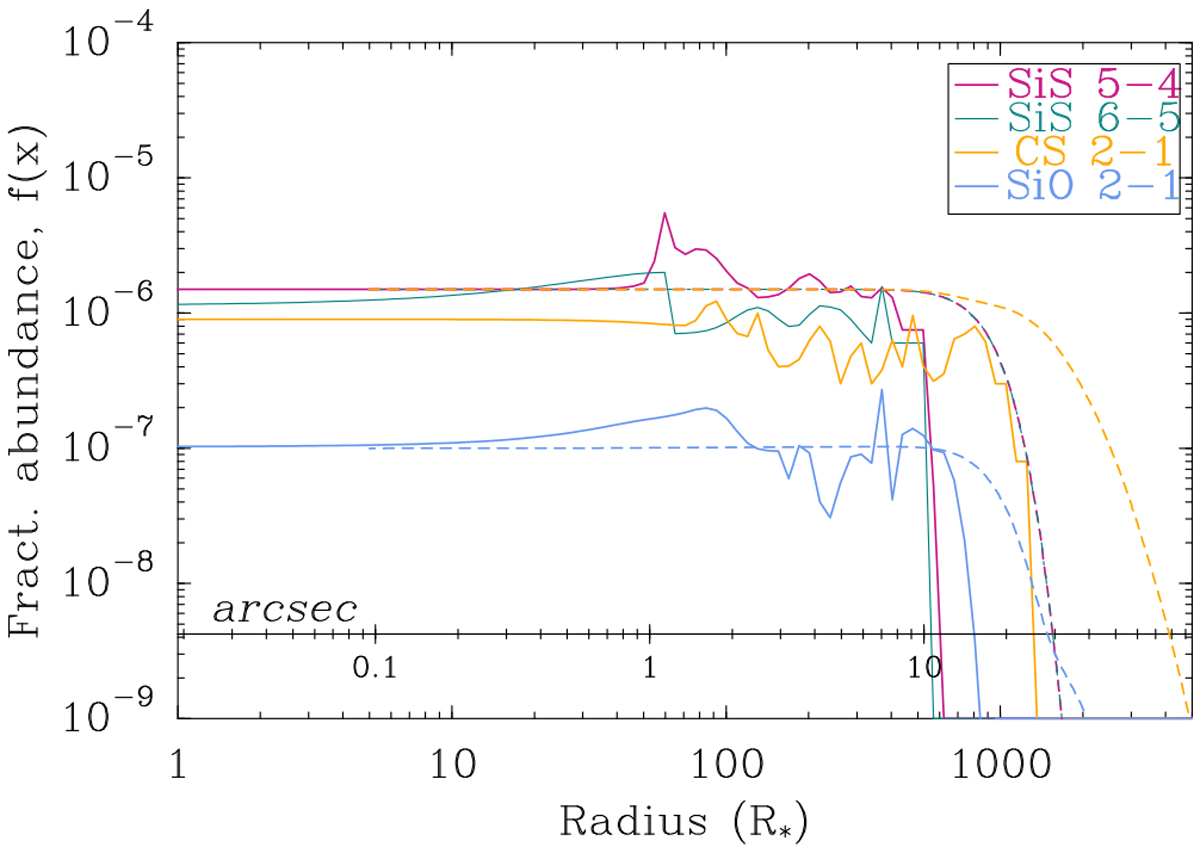
Radial abundance profiles (solid lines) used as input to model azimuthal averages in Fig. 7. The spatial scale is shown in units of the stellar radius and we also included an additional axis showing the angular scale. The equivalence between both scales is 1 R* ≃ 0.″019 ± 0.″003 (Ridgway & Keady 1988). The different radial profiles are created by using Gaussian components but due to conversion from logarithmic radial sampling the profiles display some abrupt changes. We note thatwe have used two different input abundance profiles for SiS, one for each of the lines (J = 5–4 and J = 6–5), aimed at obtaining two independent fits. Both profiles are very similar, and the true and single radial distribution of SiS may be between both profiles. The results from the chemical models described in Sect. 5 are represented by dashed lines of the same colours, except for the SiS line where both magenta and green colours are used. The fractional abundance value is relative to H2.
Current usage metrics show cumulative count of Article Views (full-text article views including HTML views, PDF and ePub downloads, according to the available data) and Abstracts Views on Vision4Press platform.
Data correspond to usage on the plateform after 2015. The current usage metrics is available 48-96 hours after online publication and is updated daily on week days.
Initial download of the metrics may take a while.