Fig. 8
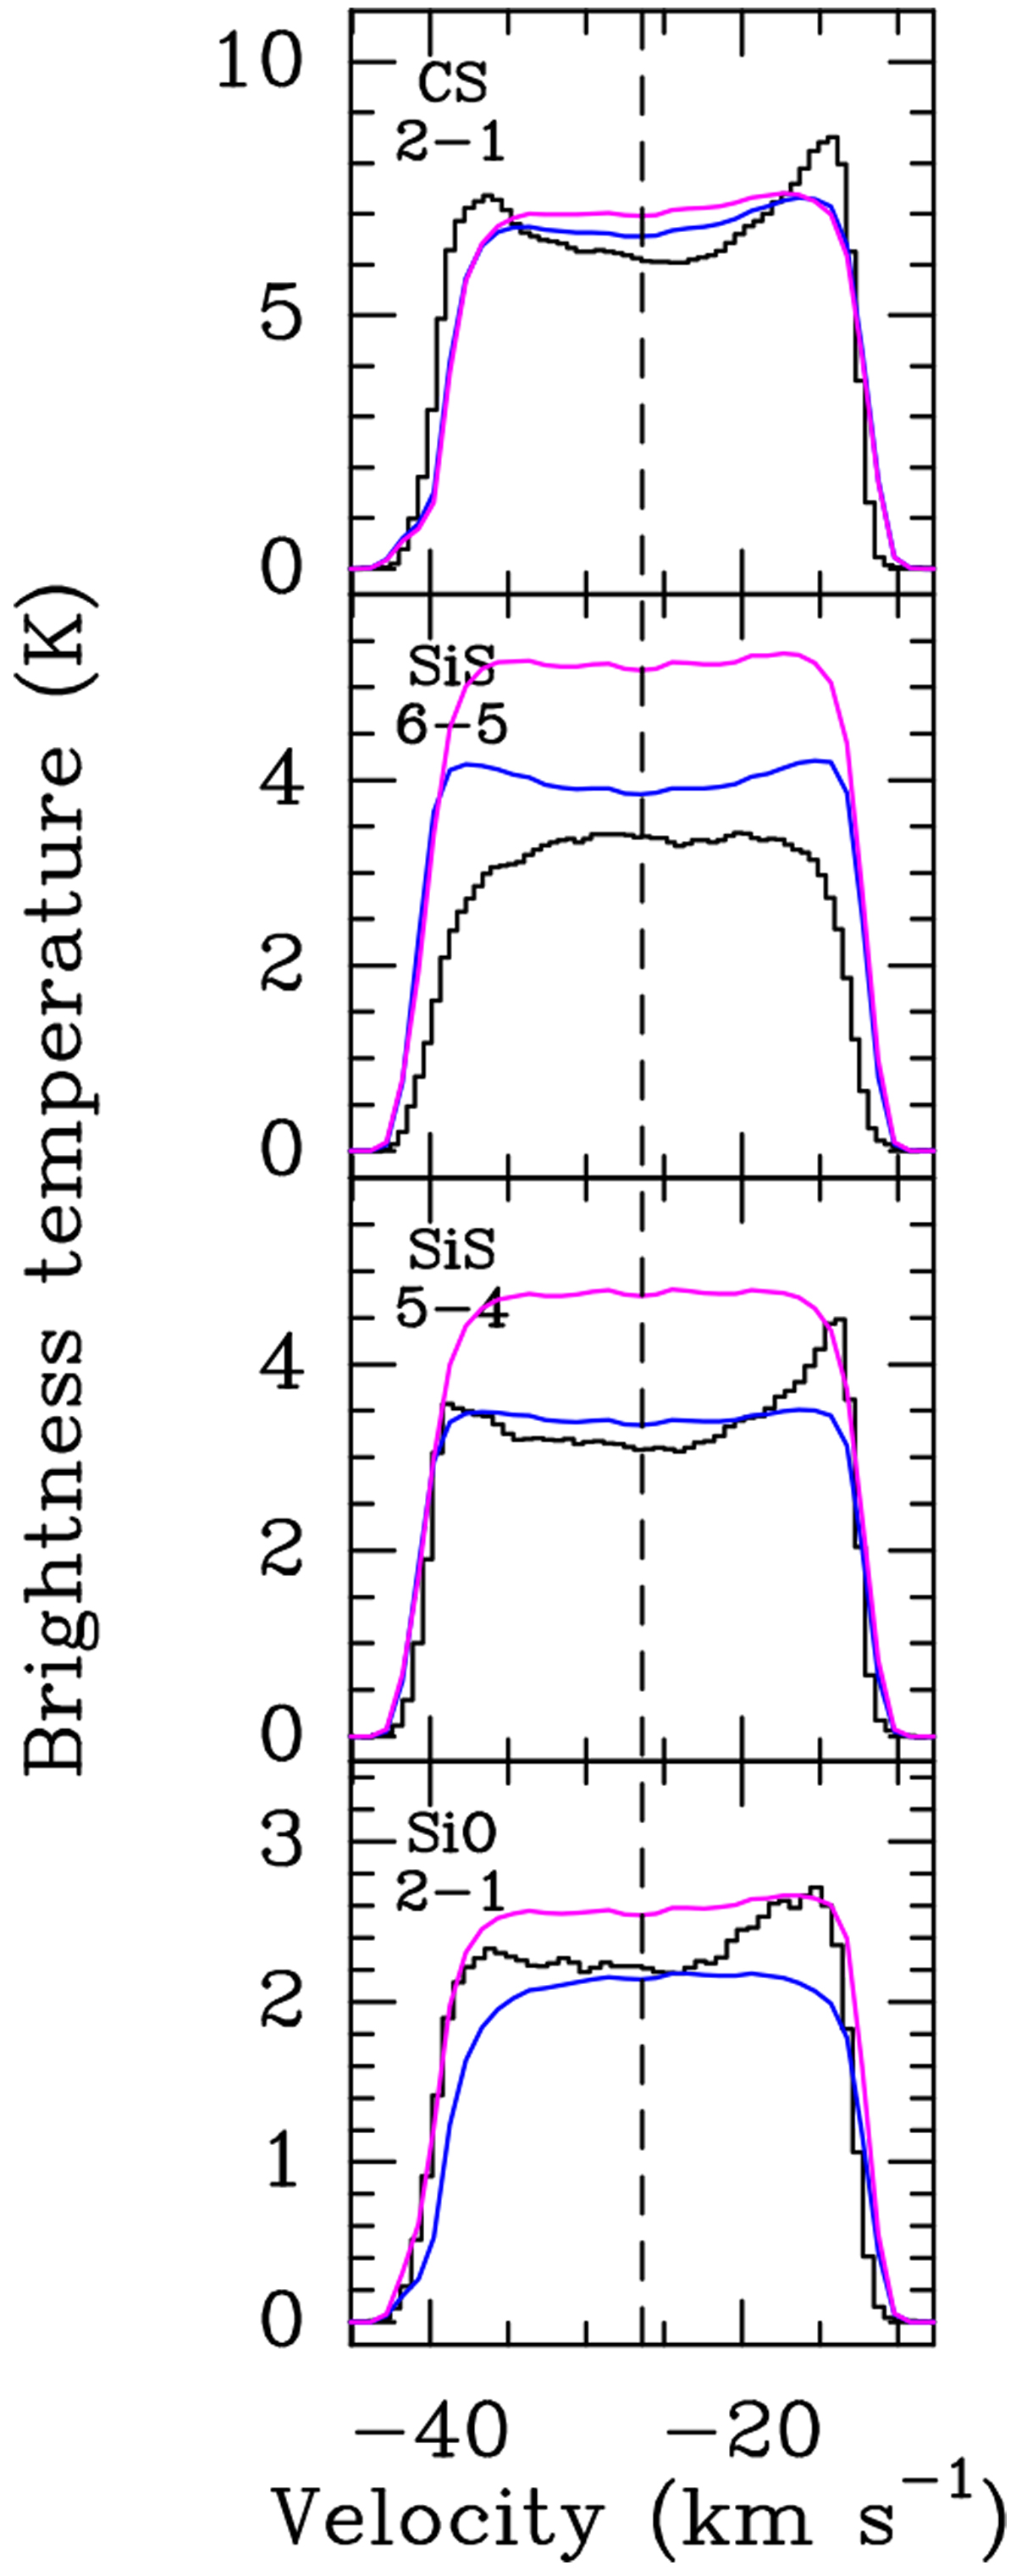
Spectrum of four lines (black histogram) towards star position as observed with IRAM-30 m telescope. The HPBW for the different frequencies is 20.″3 for SiO J = 2–1, 27.″1 for SiS J = 5–4, 22.″6 for SiS J = 6–5, and 25.″1 for CS J = 2–1. The coloured curves represent different synthetic spectra created with our radiative transfer code by using different input radialabundance profiles (see Sect. 4). The blue curves represent the model with which we used the radial abundance profiles shown in Fig. 9 (solid lines in that figure) as input, that is, the best fit profiles to the azimuthal average of the brightness distribution of the emission at the systemic velocity of the source from the ALMA and OTF-30 m merged data. The curves in magenta represent the model with which we used the same input abundance profile but without including any source of continuum radiation in the model, in order to evaluate the impact that IR radiative pumping, produced by the star and the dust, may have in the models.
Current usage metrics show cumulative count of Article Views (full-text article views including HTML views, PDF and ePub downloads, according to the available data) and Abstracts Views on Vision4Press platform.
Data correspond to usage on the plateform after 2015. The current usage metrics is available 48-96 hours after online publication and is updated daily on week days.
Initial download of the metrics may take a while.