Fig. 7
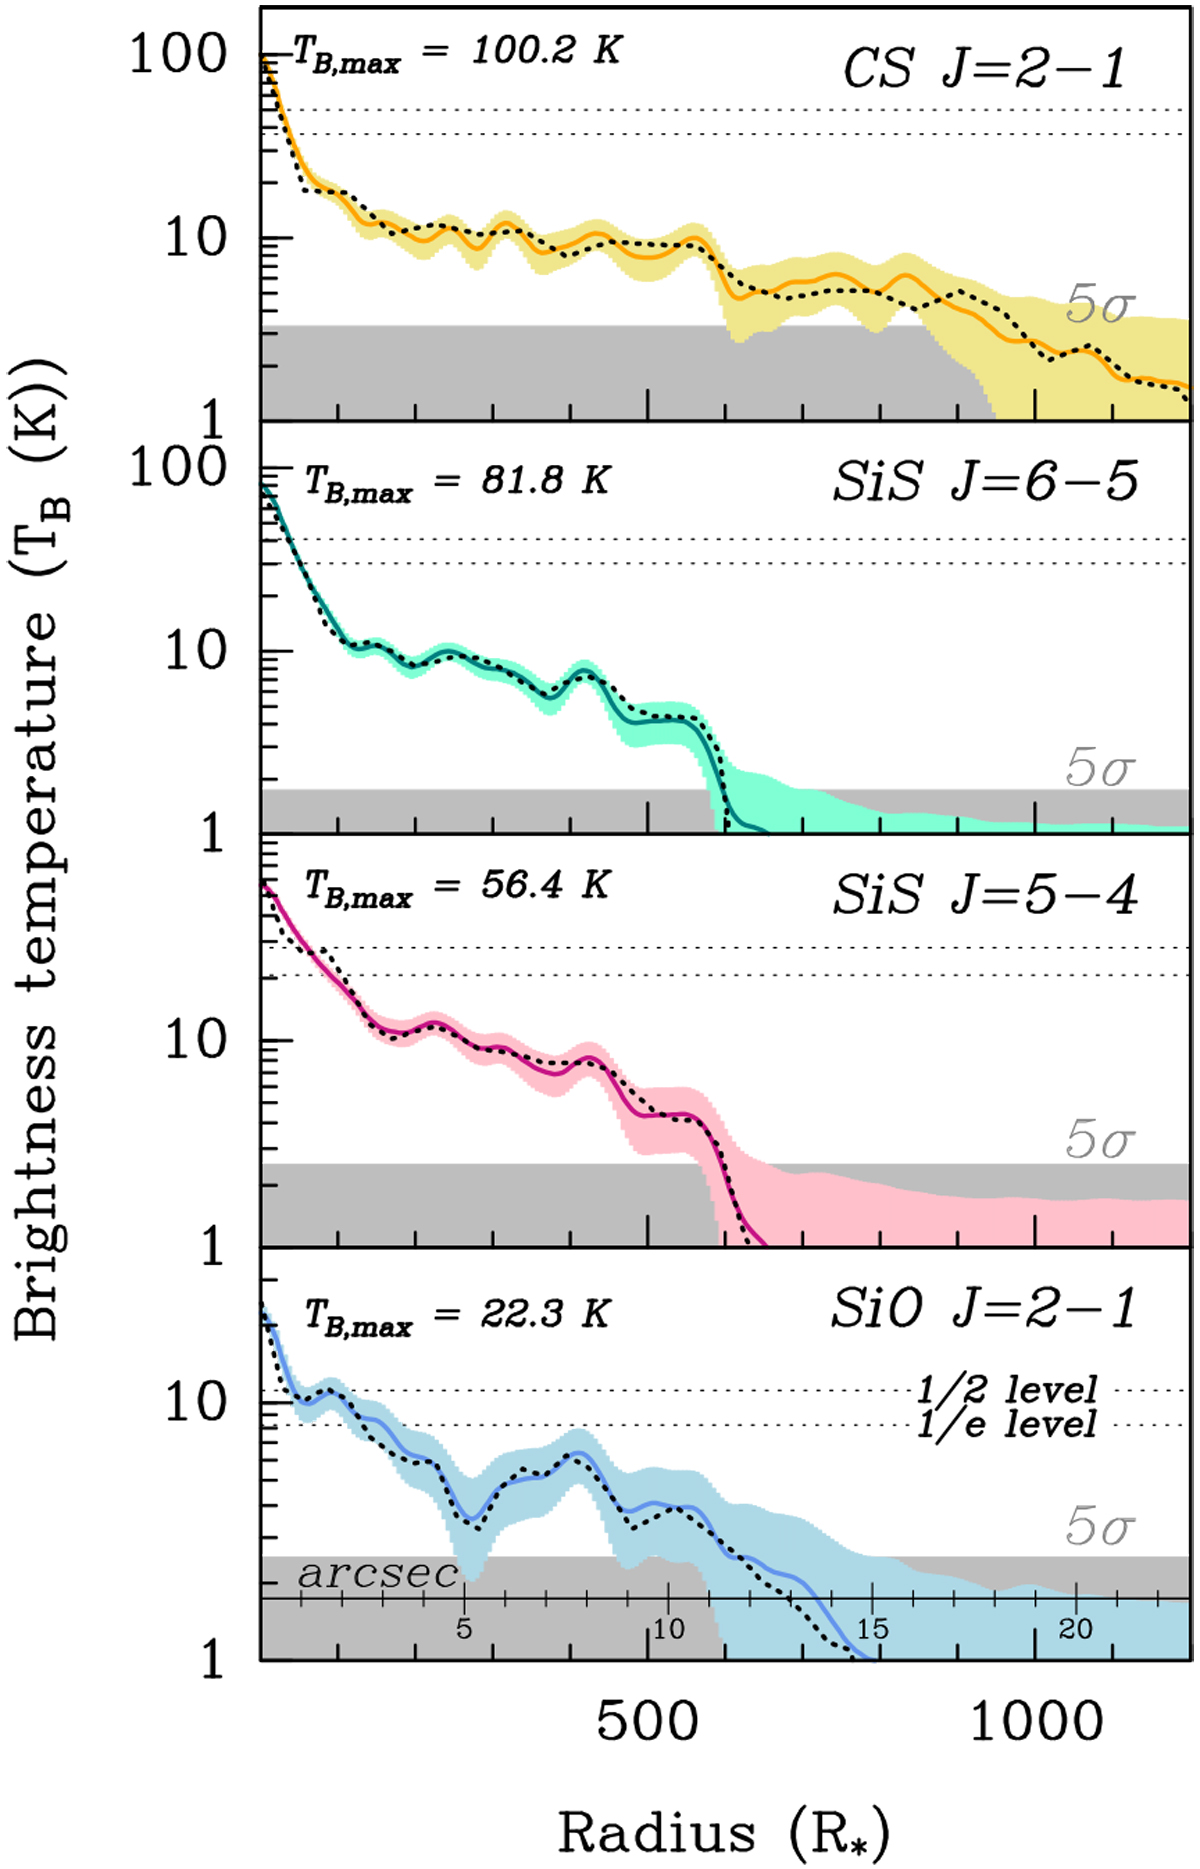
Azimuthal average of brightness distribution of four main isotopologue lines detected of CS (yellow line), SiS (green and red lines), and SiO (blue line). The flux density has been converted to brightness temperature, and the verticalscale is shown in logarithmic scale to improve the visualisation of the plot. The uncertainty intervals (3σ) are also shown in each curve with similar colours. The spatial scale is shown in units of the stellar radius and we also included an additional axis showing the angular scale in the bottom box. The equivalence between both scales is 1 R* ≃ 0.″019 (Ridgway & Keady 1988). On each box, the 5σ-level detection limit is shown in grey. We also indicate the maximum value of the brightness temperature for each distribution, which in all cases corresponds to the central pixel. We marked the levels in which the temperature decreased by half and by a factor of e of its maximum value. The results from the radiative transfer models (see Sect. 4) are shown as dashed black lines in each box.
Current usage metrics show cumulative count of Article Views (full-text article views including HTML views, PDF and ePub downloads, according to the available data) and Abstracts Views on Vision4Press platform.
Data correspond to usage on the plateform after 2015. The current usage metrics is available 48-96 hours after online publication and is updated daily on week days.
Initial download of the metrics may take a while.