Fig. 5
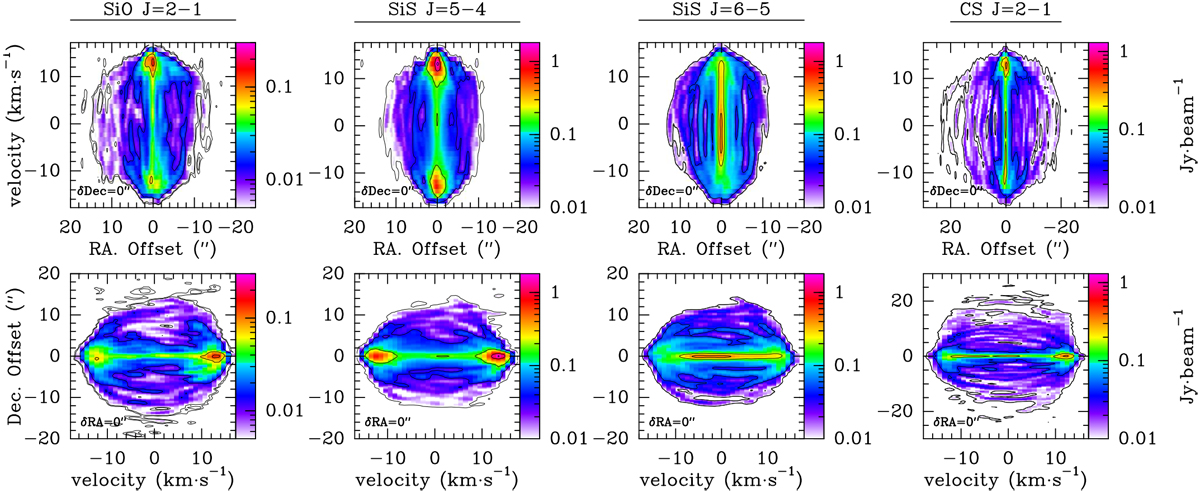
Position–velocity (PV) diagrams of detected lines of SiO, SiS, and CS main isotopologues. The contours shown in black correspond to 5σ, 2, 10, 50, and 90% of the peak emission (see Table 1 for details). Top: PV diagram of the flux density is shown corresponding to a plane with a declination offset (see Sect. 2) equal to zero. Bottom: PV diagram of the flux density is shown corresponding to a plane with a right ascension offset (see Sect. 2) equal to zero.
Current usage metrics show cumulative count of Article Views (full-text article views including HTML views, PDF and ePub downloads, according to the available data) and Abstracts Views on Vision4Press platform.
Data correspond to usage on the plateform after 2015. The current usage metrics is available 48-96 hours after online publication and is updated daily on week days.
Initial download of the metrics may take a while.