Fig. 10
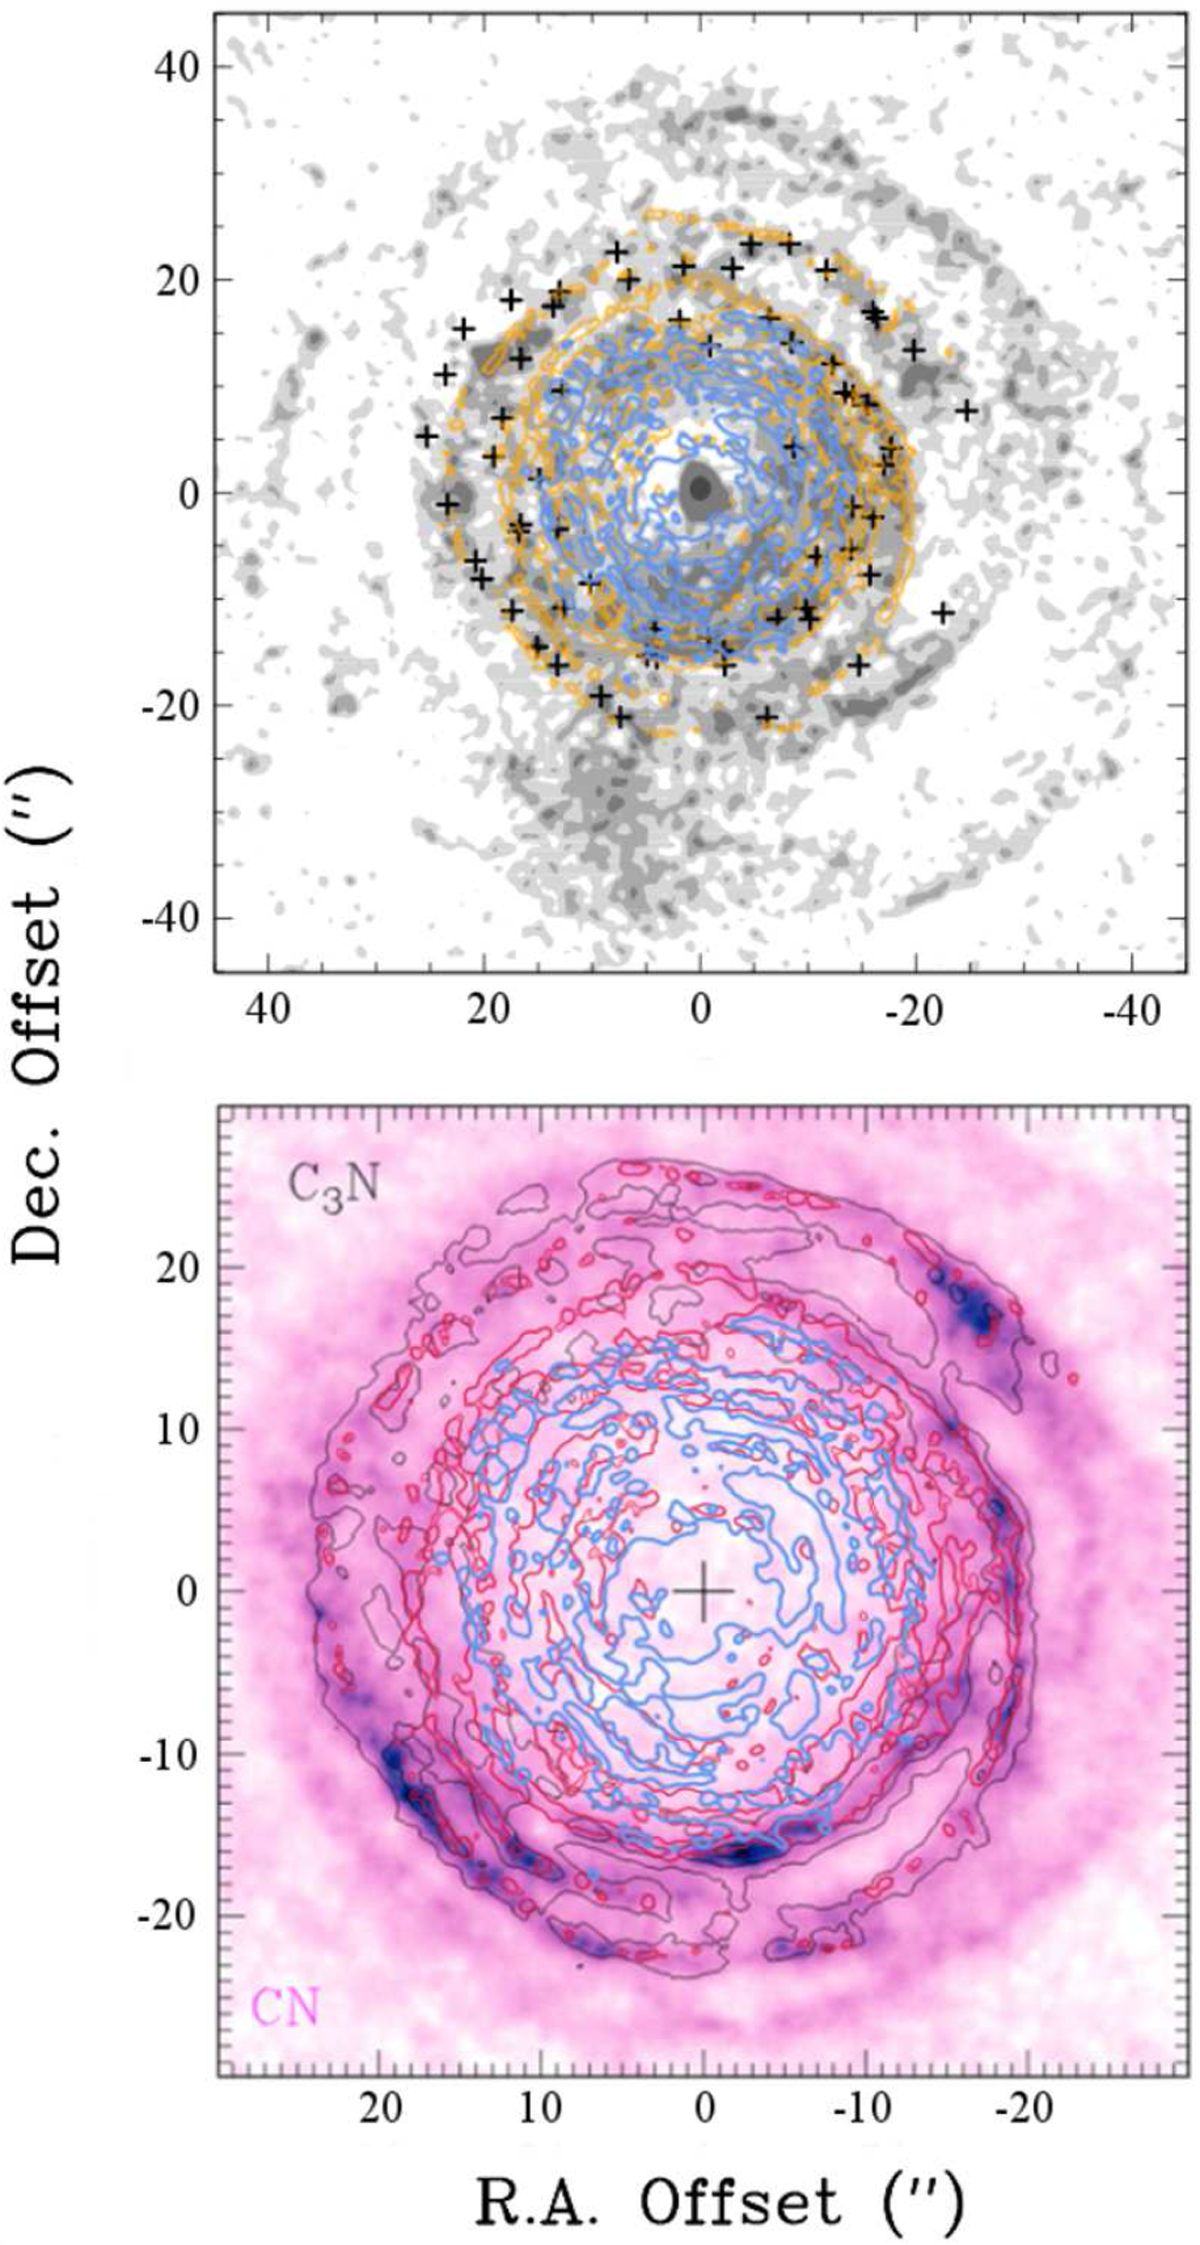
Top: comparison between the gas spatial distribution of the J = 2–1 CS and SiO emission in orange and blue contours, respectively, and the dust distribution reported in Mauron & Huggins (1999) as seen in V +B, where the dark arcs and shells trace the location of the dust (background image in black and white colour scale). The small crosses in the image are also from Mauron & Huggins (1999), and represent the emission peaks of other molecular tracers, namely CN, HNC, and HC3 N reported in Lucas et al. (1995) and Lucas & Guélin (1999). Bottom: same contours representing J = 2–1 CS and SiO emission, with J = 2–1 CS contours in red (changed to improve the visualisation) and J = 2–1 SiO in blue, plotted over C3N N = 10–9 (black contours) and CN N = 1–0 (background image in pink colour scale) as reported by Agúndez et al. (2017). We note that the spatial scale between both figures is different.
Current usage metrics show cumulative count of Article Views (full-text article views including HTML views, PDF and ePub downloads, according to the available data) and Abstracts Views on Vision4Press platform.
Data correspond to usage on the plateform after 2015. The current usage metrics is available 48-96 hours after online publication and is updated daily on week days.
Initial download of the metrics may take a while.