Fig. 1
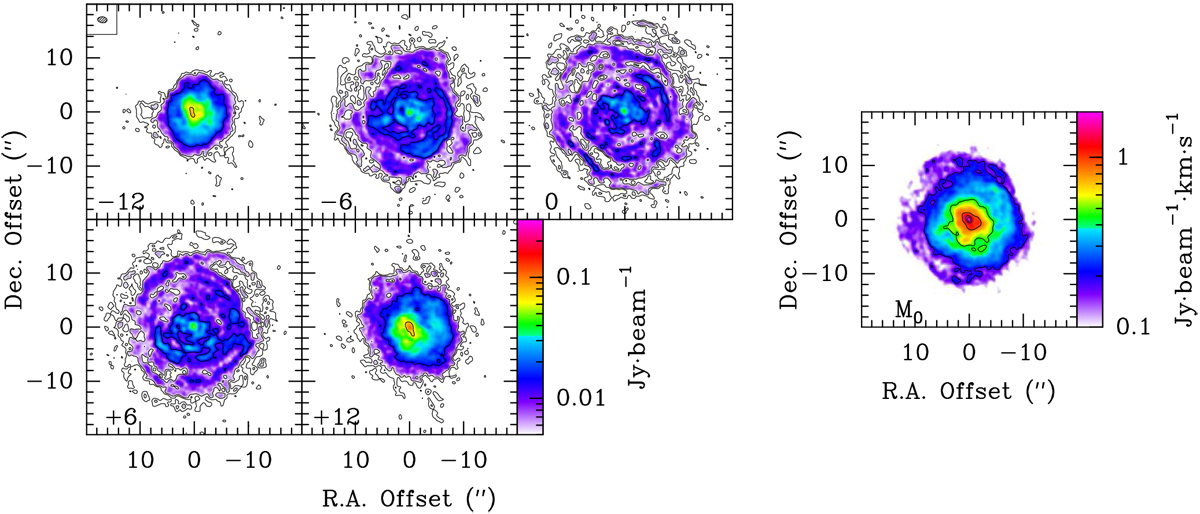
SiO J = 2–1 maps extracted from high spatial-resolution data cube. Left: flux density (Sν) maps at different offset velocities with respect to the systemic velocity of the source (v* ~ −26.5 km s−1, Cernicharo et al. 2000) in LSR scale. The central velocity offset of each channel is shown at the bottom-left corner of each panel in kilometres per second. The width of each velocity channel is approximately 1 km s−1. The coordinates are given as offsets from the source position in arcseconds (see Sect. 2). The size and orientation of the synthetic beam are shown at the top-left corner inside the first panel. The contours shown in black correspond to 5σ, 2, 10, 50, and 90% of the peak flux density (see Table 1). Right: moment zero map. The contours shown correspond to 10, 25, 50, 75, and 90% of the peak emission (see Table 1).
Current usage metrics show cumulative count of Article Views (full-text article views including HTML views, PDF and ePub downloads, according to the available data) and Abstracts Views on Vision4Press platform.
Data correspond to usage on the plateform after 2015. The current usage metrics is available 48-96 hours after online publication and is updated daily on week days.
Initial download of the metrics may take a while.