Fig. 7
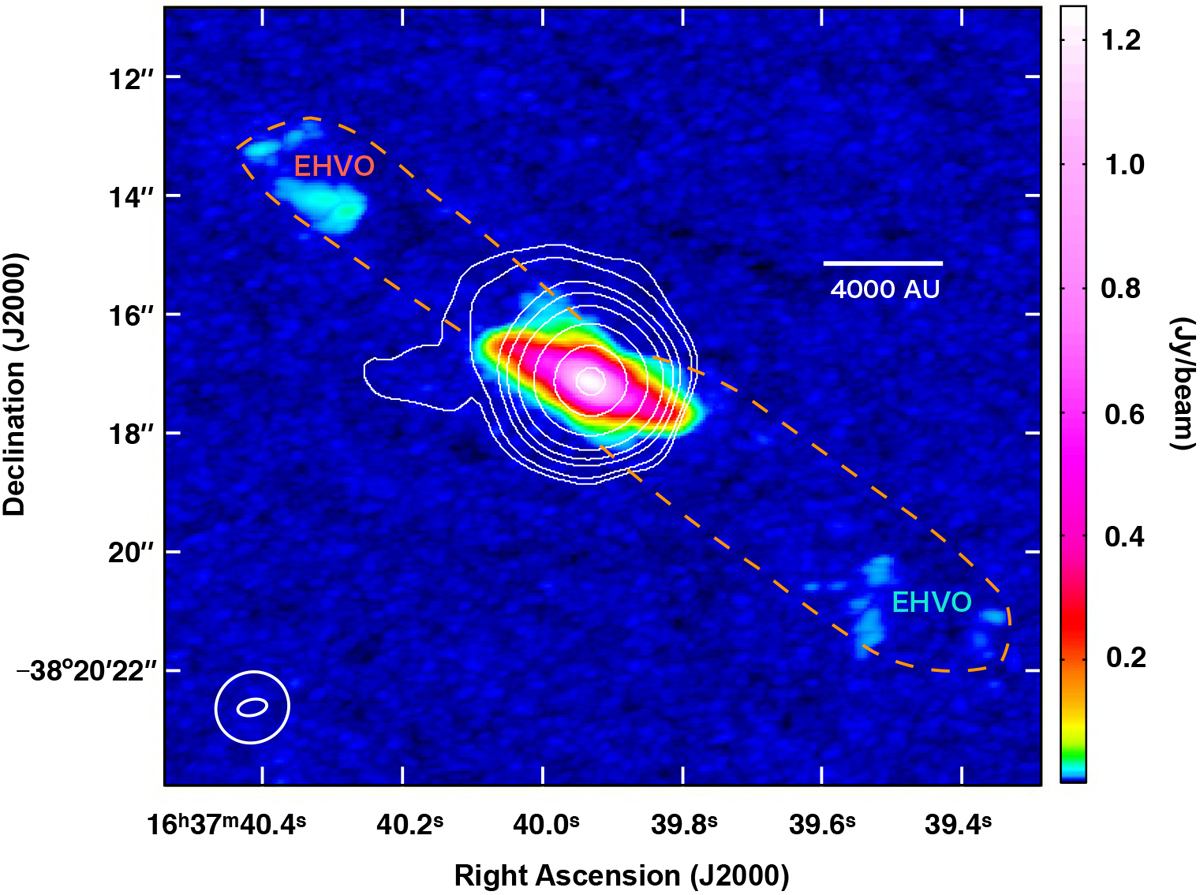
CO emission from IRAS 16342−3814. The colourscale corresponds to the moment-8 (maximum value of the spectrum for each pixel) image of the CO(J = 3 → 2) emission. The contours indicate the CO(J = 1 → 0) emission averaged over the velocity range −10 < voffset(km s−1) < +10 with values (0.007, 0.01, 0.02, 0.03, 0.05, 0.1, 0.2, 0.3) Jy beam−1, where the first contour represents four times the value of the rms. The orange dashed line delineates the region that contains emission from the EHVO. The ellipses located at the lower left corner indicate the synthesised beams of the CO(J = 3 → 2) and CO(J = 1 → 0) observations, respectively. The beam size of the CO(J = 3 → 2) observations is the same as in Fig. 2 and the beam size of the CO(J = 1 → 0) observationsis 1.′′25 × 1.′′18 with PA = −58°.
Current usage metrics show cumulative count of Article Views (full-text article views including HTML views, PDF and ePub downloads, according to the available data) and Abstracts Views on Vision4Press platform.
Data correspond to usage on the plateform after 2015. The current usage metrics is available 48-96 hours after online publication and is updated daily on week days.
Initial download of the metrics may take a while.