Fig. 6
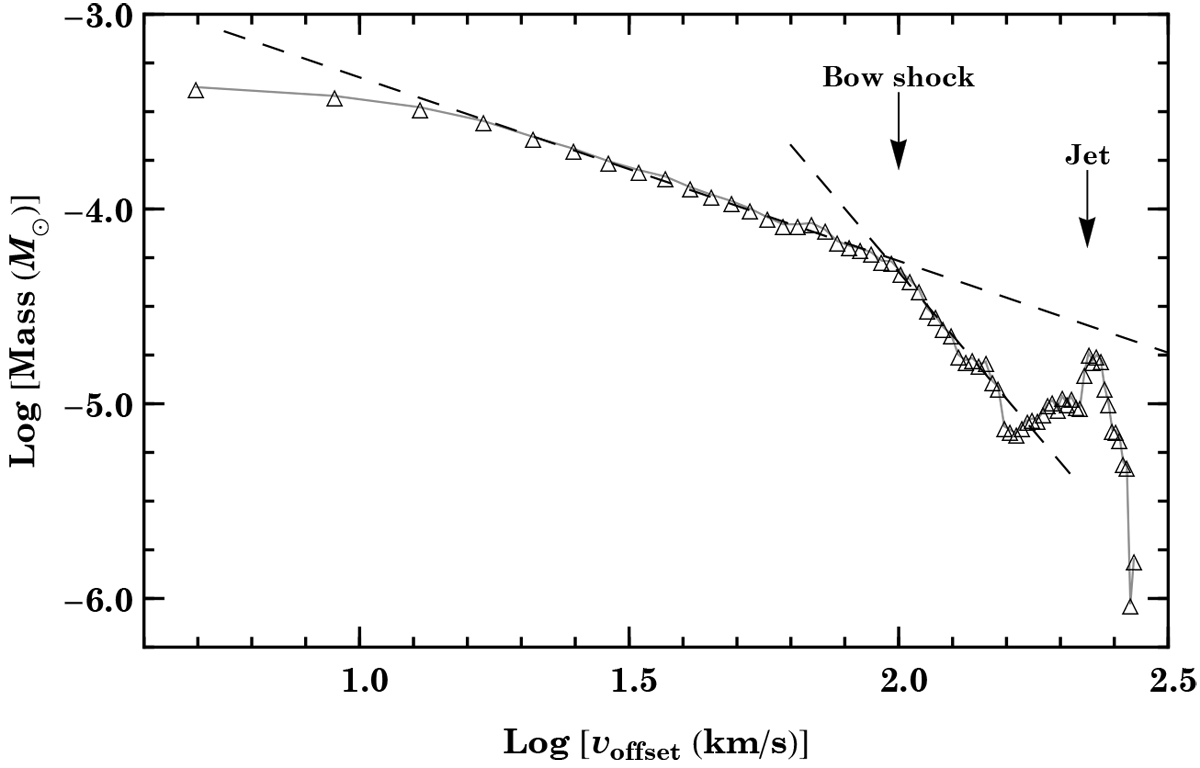
Molecular mass as a function of expansion velocity obtained from emission blue-shifted with respect to systemic velocity. The dashed lines are power-law fits to the data in the velocity ranges 10 < voffset(km s−1) < 100 and 100 < voffset(km s−1) < 150, respectively.The arrows indicate the emission associated with the bow shock and the jet, respectively.
Current usage metrics show cumulative count of Article Views (full-text article views including HTML views, PDF and ePub downloads, according to the available data) and Abstracts Views on Vision4Press platform.
Data correspond to usage on the plateform after 2015. The current usage metrics is available 48-96 hours after online publication and is updated daily on week days.
Initial download of the metrics may take a while.