Free Access
Fig. 5
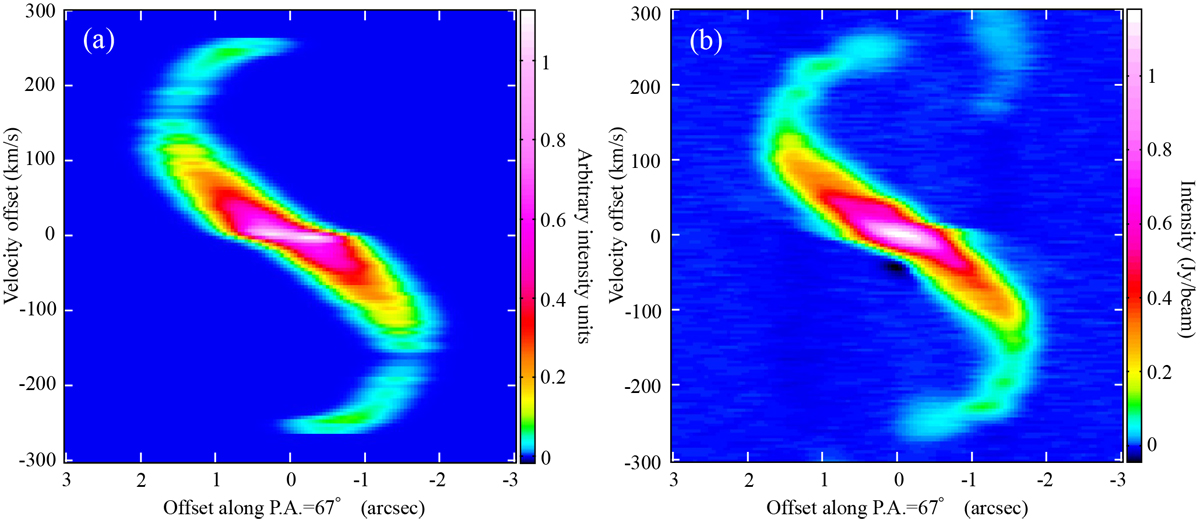
Panel a: P-V diagram of IRAS 16342−3814 obtained from SHAPE model. Panel b: P-V diagram of IRAS 16342−3814 from ALMA observations. The faint emission in the upper right corner is due to the H13CO(J = 4 → 3) line. Both P-V diagrams were obtained using a slit along PA = 67°.
Current usage metrics show cumulative count of Article Views (full-text article views including HTML views, PDF and ePub downloads, according to the available data) and Abstracts Views on Vision4Press platform.
Data correspond to usage on the plateform after 2015. The current usage metrics is available 48-96 hours after online publication and is updated daily on week days.
Initial download of the metrics may take a while.