Fig. 4
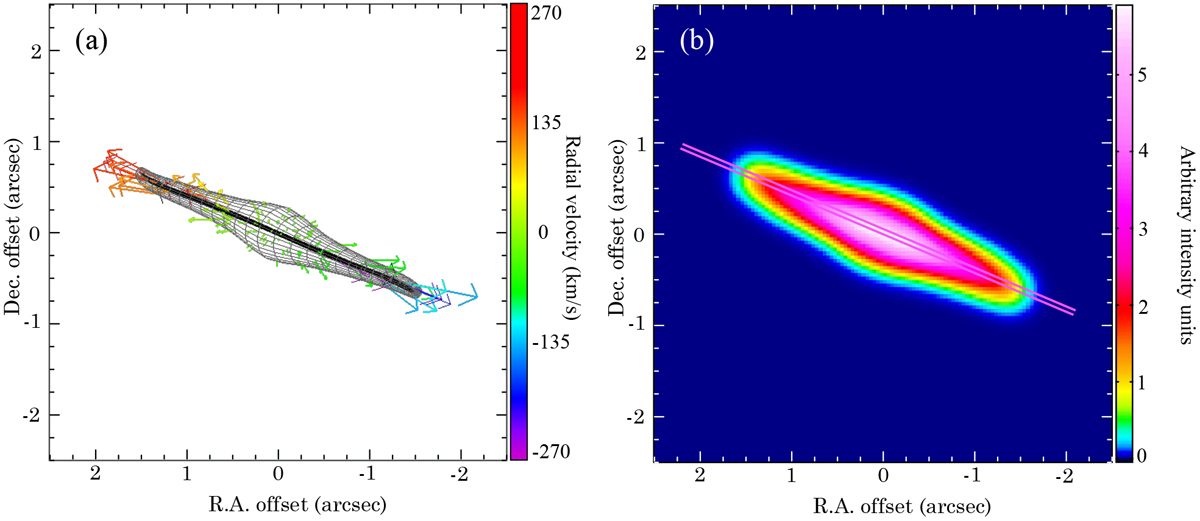
Panel a: mesh representation of spatial distribution of molecular outflow of IRAS 16342−3814. The HVC and LVC are shown in black and grey colours, respectively. The vectors represent the expansion velocity of the gas and they are coloured according to their component in the line-of-sight. Panel b: brightness distribution of CO emission obtained from render function of software SHAPE. The intensity is given in arbitrary units. The synthetic image was convolved with a Gaussian function with FWHM (full width half maximum) similar to the synthesised beam of the observations. The parallel lines at PA = 67° indicate the direction of a slit used to generate the synthetic P-V diagram shown in Fig. 5a.
Current usage metrics show cumulative count of Article Views (full-text article views including HTML views, PDF and ePub downloads, according to the available data) and Abstracts Views on Vision4Press platform.
Data correspond to usage on the plateform after 2015. The current usage metrics is available 48-96 hours after online publication and is updated daily on week days.
Initial download of the metrics may take a while.