Fig. 2
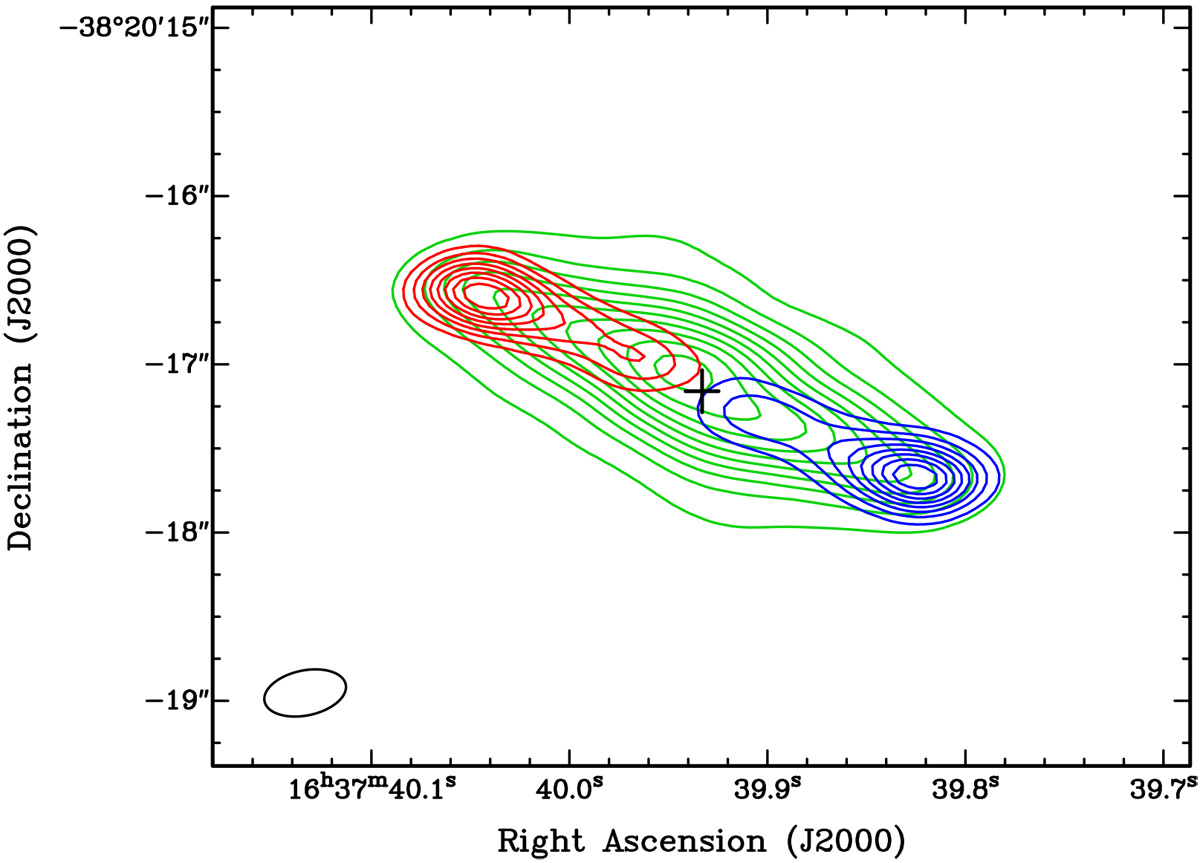
Velocity-integrated CO(J = 3 → 2) emission of IRAS 16342−3814. The blue, green, and red contours correspond to emission at velocity ranges −270 < voffset(km s−1) < −150, −150 < voffset(km s−1) < +150, and +150 < voffset(km s−1) < +270, respectively. The levels of the blue and red contours go from 20 to 90% the peak value of the emission (8.3 and 6.6 Jy beam−1 km s−1, respectively) at steps of 10%. The levels of the green contours go from 5 to 95% the peak value of the emission (50.7 Jy beam−1 km s−1) at steps of 10%. The rms value of the velocity-integrated maps is ~7 × 10⁻² Jy beam−1 km s−1. The cross indicates the peak of the continuum emission. The ellipse located at the lower left corner indicates the synthesised beam, θFWHM = 0.′′49 × 0.′′27, position angle (PA) = −78°.
Current usage metrics show cumulative count of Article Views (full-text article views including HTML views, PDF and ePub downloads, according to the available data) and Abstracts Views on Vision4Press platform.
Data correspond to usage on the plateform after 2015. The current usage metrics is available 48-96 hours after online publication and is updated daily on week days.
Initial download of the metrics may take a while.