Fig. 1
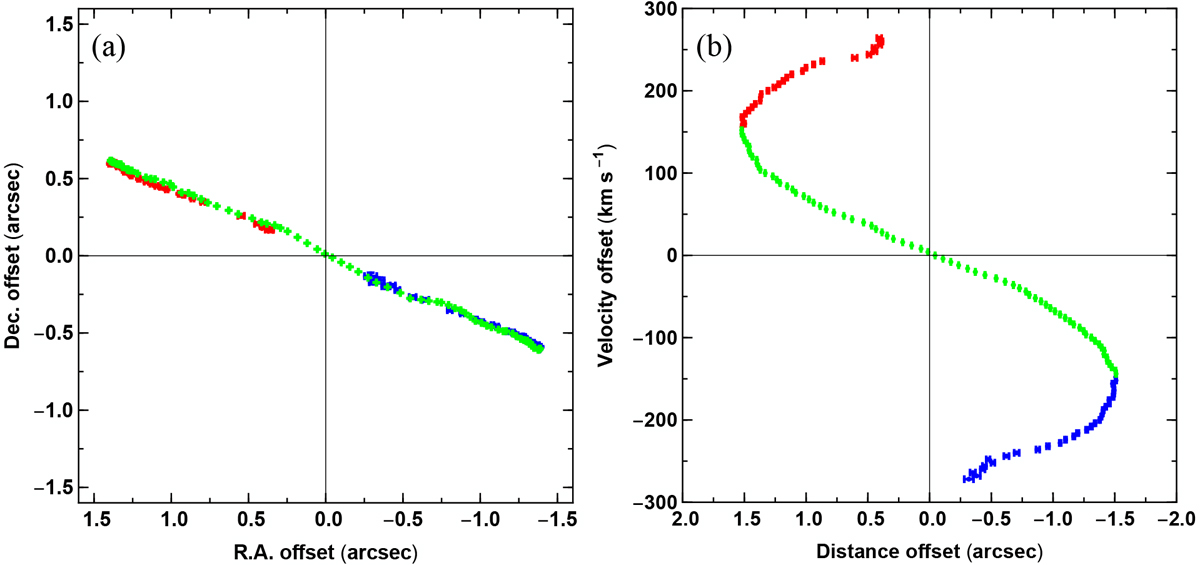
Kinematical components of CO(3 → 2) emission from IRAS 16342−3814. Panel a: peak positions of the brightness distribution of CO(3 → 2) emission foreach individual velocity channel obtained with the task JMFIT of AIPS. The origin corresponds to the non-weighted mean position of the distribution. The negative right ascension (RA) offsets are on the right side of the plot. Panel b: distance offsets from the mean position as a function of the velocity offset from the systemic velocity vsys, LSR = 45 km s−1. The colour of the data points are coded according to their velocity gradient,|dv|/|dr|: green for |dv|/|dr|>0, and blue andred for |dv|/|dr| < 0. The negative distance offsets correspond to data points with negative RA offsets and these are on the right side of the plot. The error bars of the positions are included in the plot but their size is similar to the size of the data points.
Current usage metrics show cumulative count of Article Views (full-text article views including HTML views, PDF and ePub downloads, according to the available data) and Abstracts Views on Vision4Press platform.
Data correspond to usage on the plateform after 2015. The current usage metrics is available 48-96 hours after online publication and is updated daily on week days.
Initial download of the metrics may take a while.