Fig. 9.
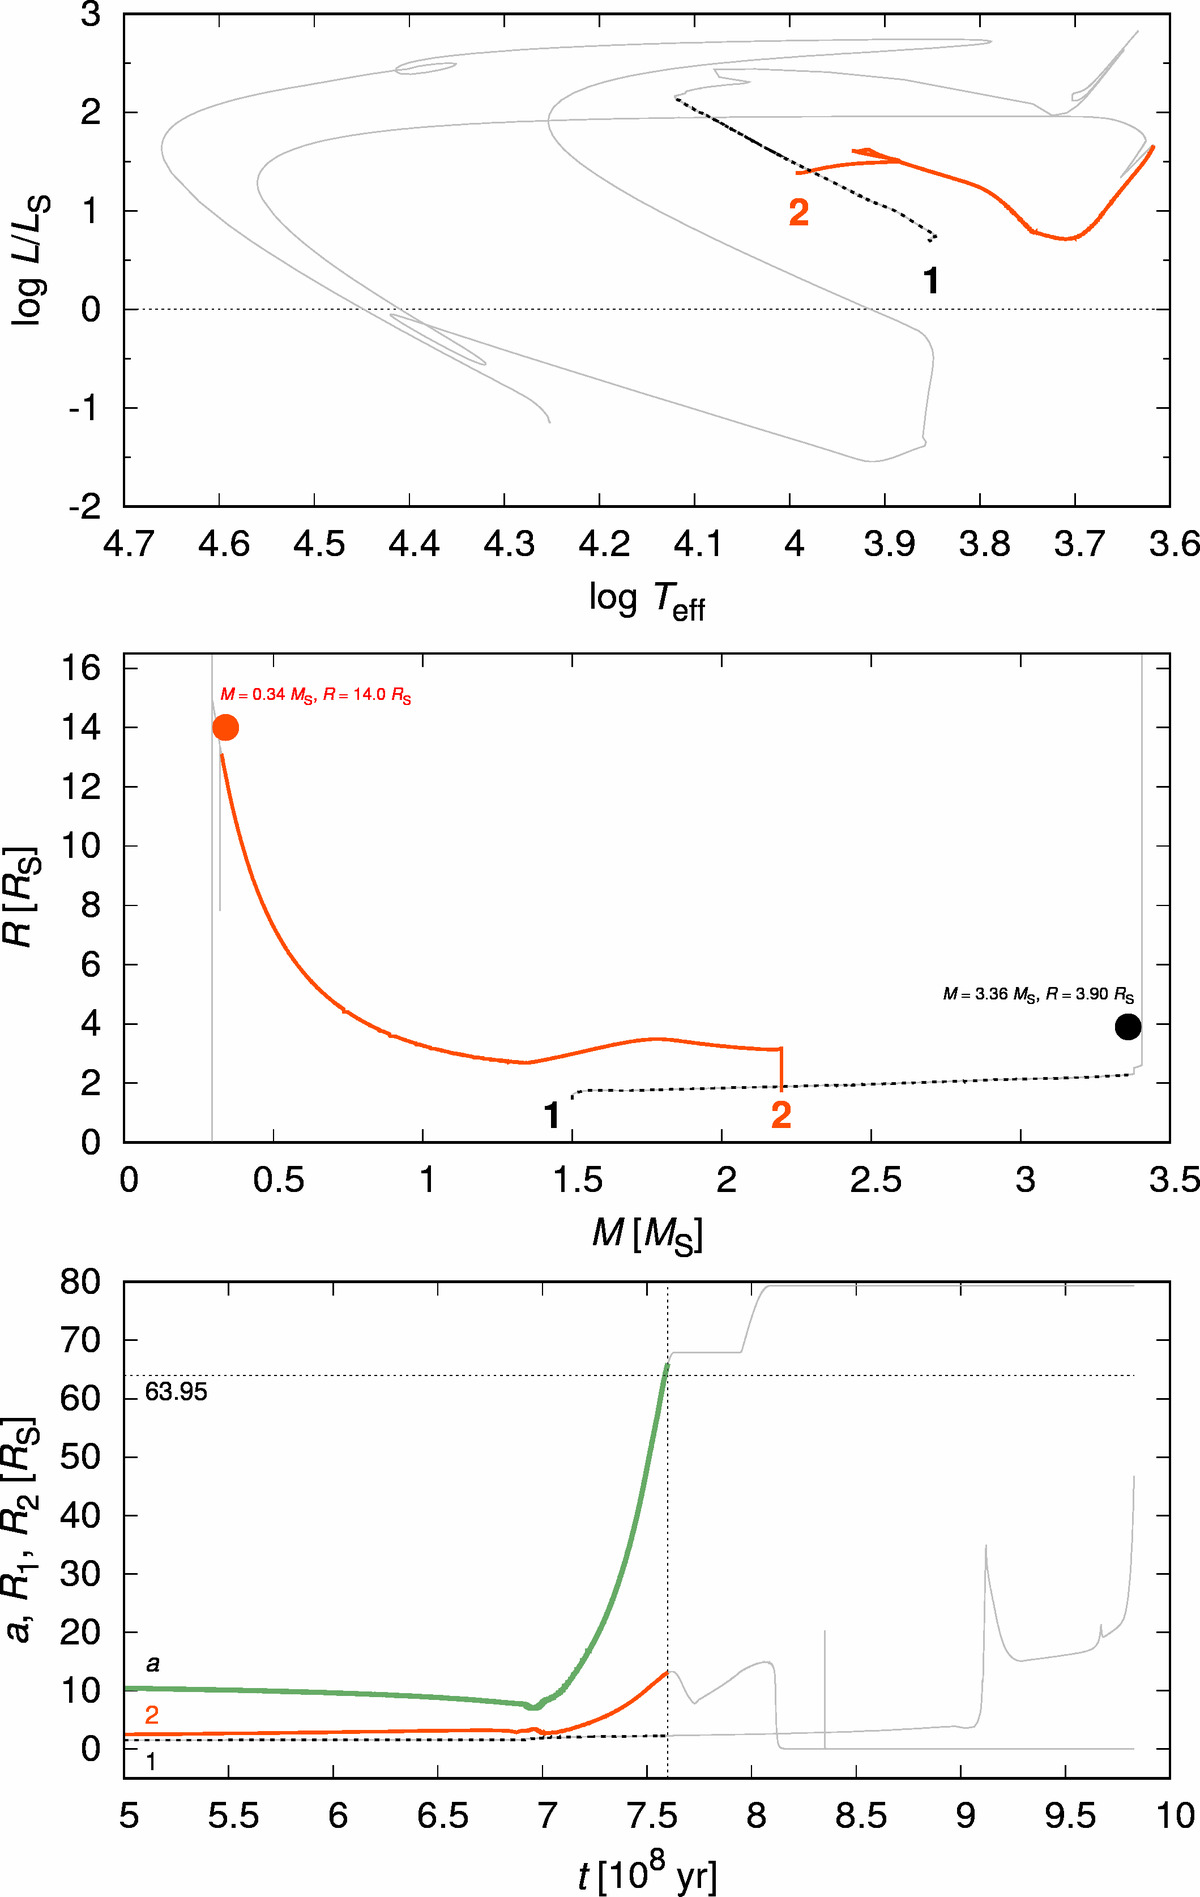
Long-term evolution of HD 81357 binary as computed by MESA (Paxton et al. 2015). The initial masses were M1 = 1.5 M⊙, M2 = 2.2 M⊙, and the initial period P = 2.4 d. Top: HR diagram with the (resulting) primary denoted as 1 (dashed black line), secondary as 2 (solid orange line) at the beginning of the evolutionary tracks (ZAMS). Middle: the radius R vs. mass M; the corresponding observed values are also indicated (filled circles). Bottom: semimajor axis a of the binary orbit (green) and the radii R1, R2 of the components vs. time t. The observed value a = 63.95 R⊙ and the time t ≐ 7.6 × 10⁸ yr with the maximal R2 are indicated (thin dotted). Later evolutionary phases are also plotted (solid grey line).
Current usage metrics show cumulative count of Article Views (full-text article views including HTML views, PDF and ePub downloads, according to the available data) and Abstracts Views on Vision4Press platform.
Data correspond to usage on the plateform after 2015. The current usage metrics is available 48-96 hours after online publication and is updated daily on week days.
Initial download of the metrics may take a while.