Fig. 8.
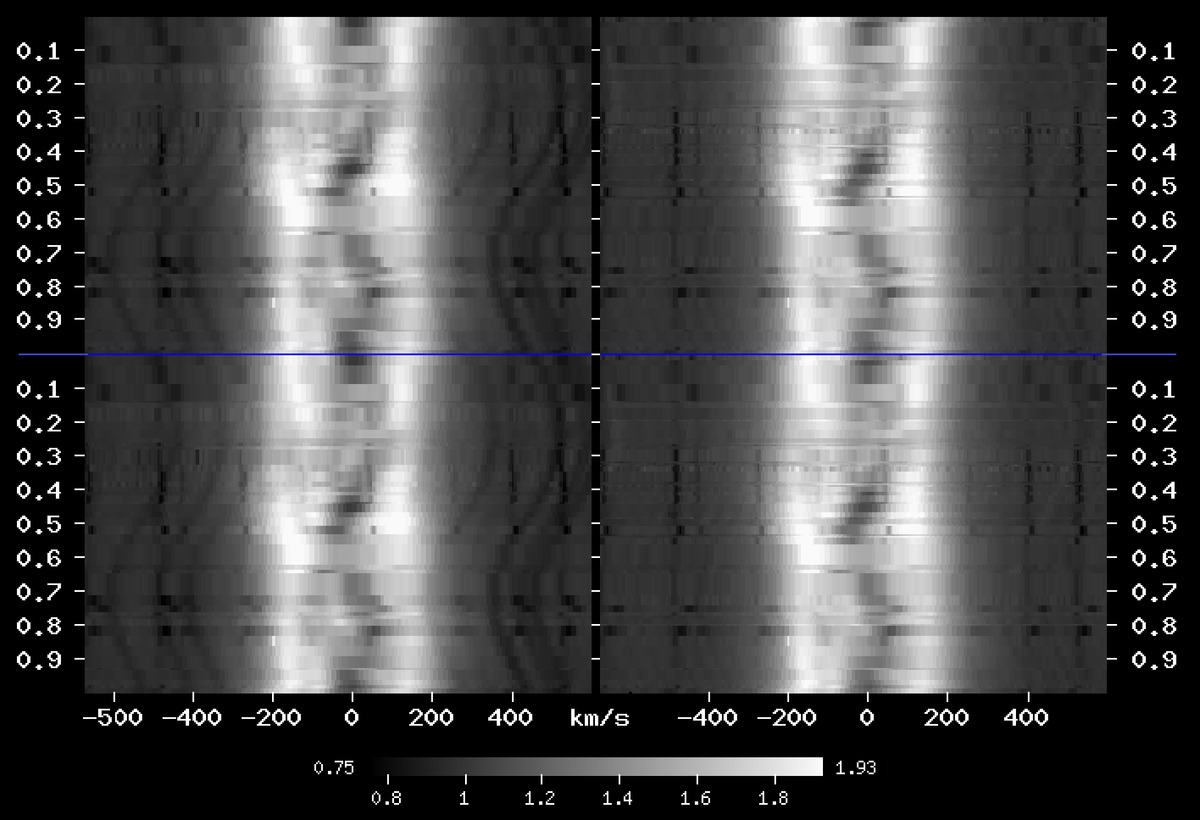
Dynamical spectra in the neighbourhood of the Hα profile in a grey-scale representation created in the program phdia. Left-hand panel: observed spectra; right-hand panel: difference spectra after the subtraction of a synthetic spectrum (including the Hα profile) of star 2. The phases shown on both sides of the figure, correspond to ephemeris (3). The spectra are repeated over two orbital cycles to show the continuity of the orbital phase changes.
Current usage metrics show cumulative count of Article Views (full-text article views including HTML views, PDF and ePub downloads, according to the available data) and Abstracts Views on Vision4Press platform.
Data correspond to usage on the plateform after 2015. The current usage metrics is available 48-96 hours after online publication and is updated daily on week days.
Initial download of the metrics may take a while.