Fig. 4.
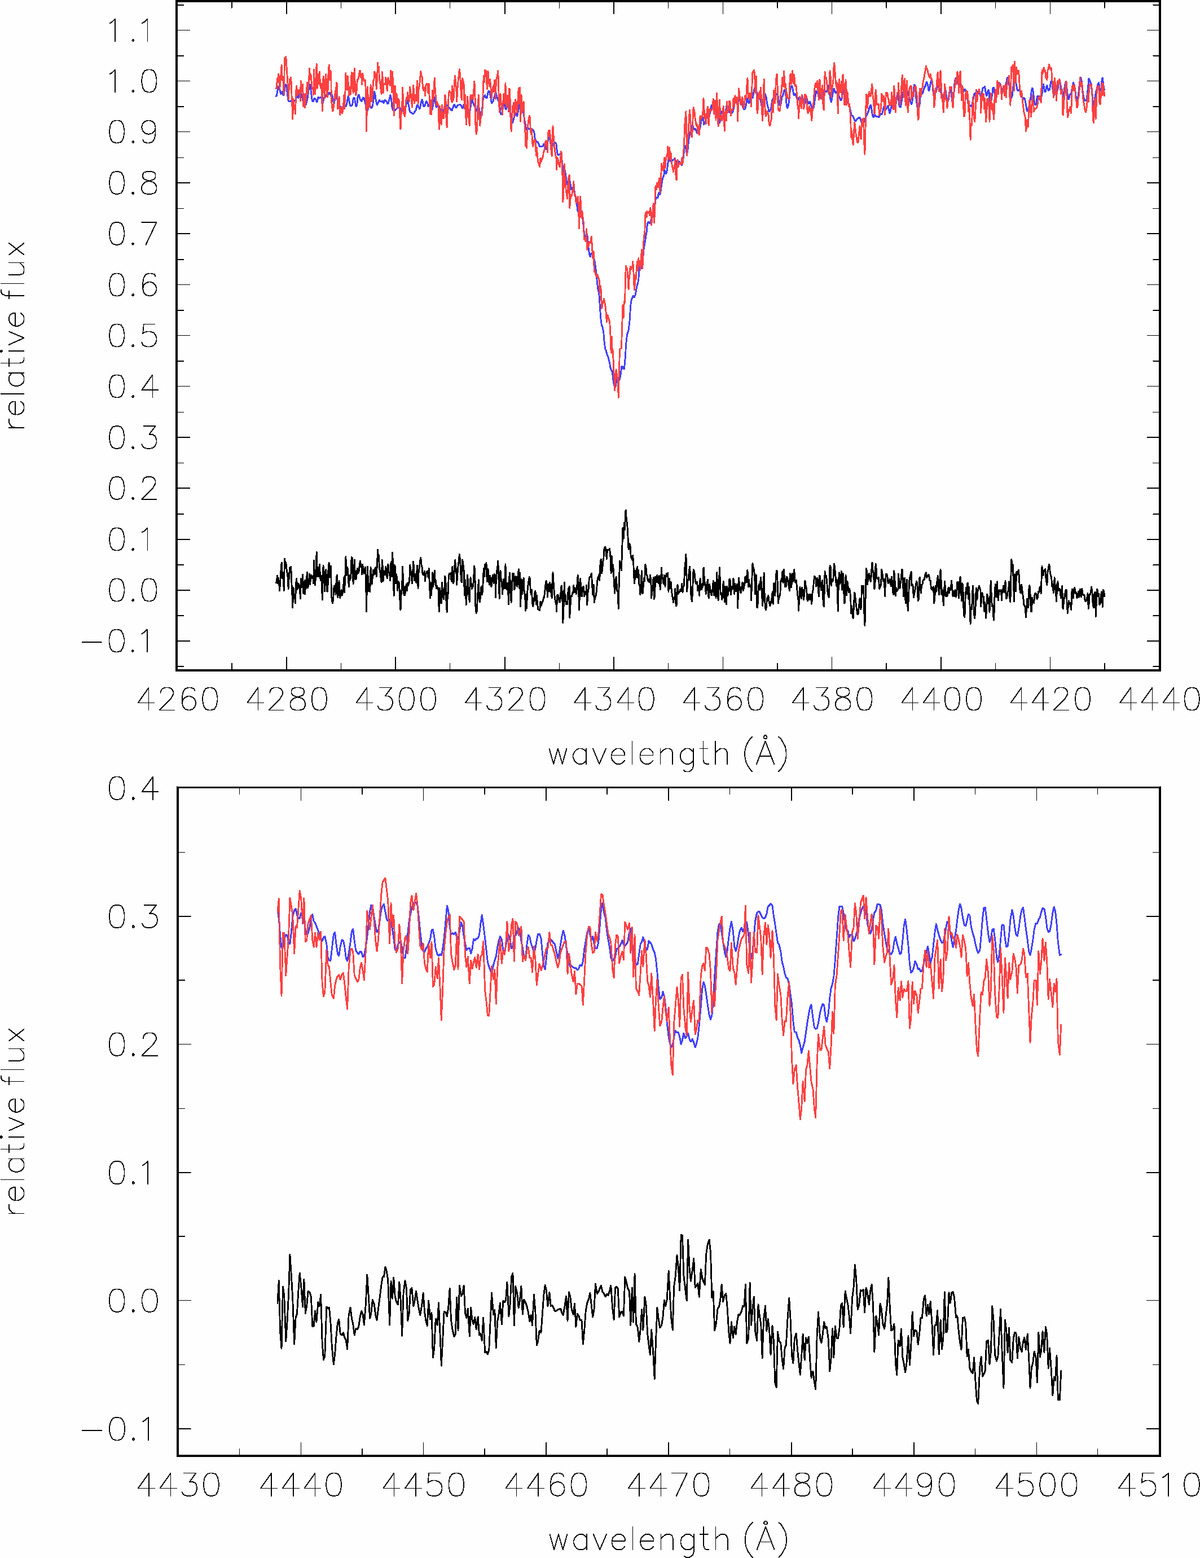
Example of the comparison of an observed blue spectrum in two selected spectral regions with a combination of two synthetic spectra. The residuals in the sense observed minus synthetic are also shown on the same flux scale. To save space, the spectra in the bottom panel were linearly shifted from 1.0 to 0.3. The Hγ emission clearly stands out in the residuals in the first panel. See the text for details.
Current usage metrics show cumulative count of Article Views (full-text article views including HTML views, PDF and ePub downloads, according to the available data) and Abstracts Views on Vision4Press platform.
Data correspond to usage on the plateform after 2015. The current usage metrics is available 48-96 hours after online publication and is updated daily on week days.
Initial download of the metrics may take a while.