Fig. 4.
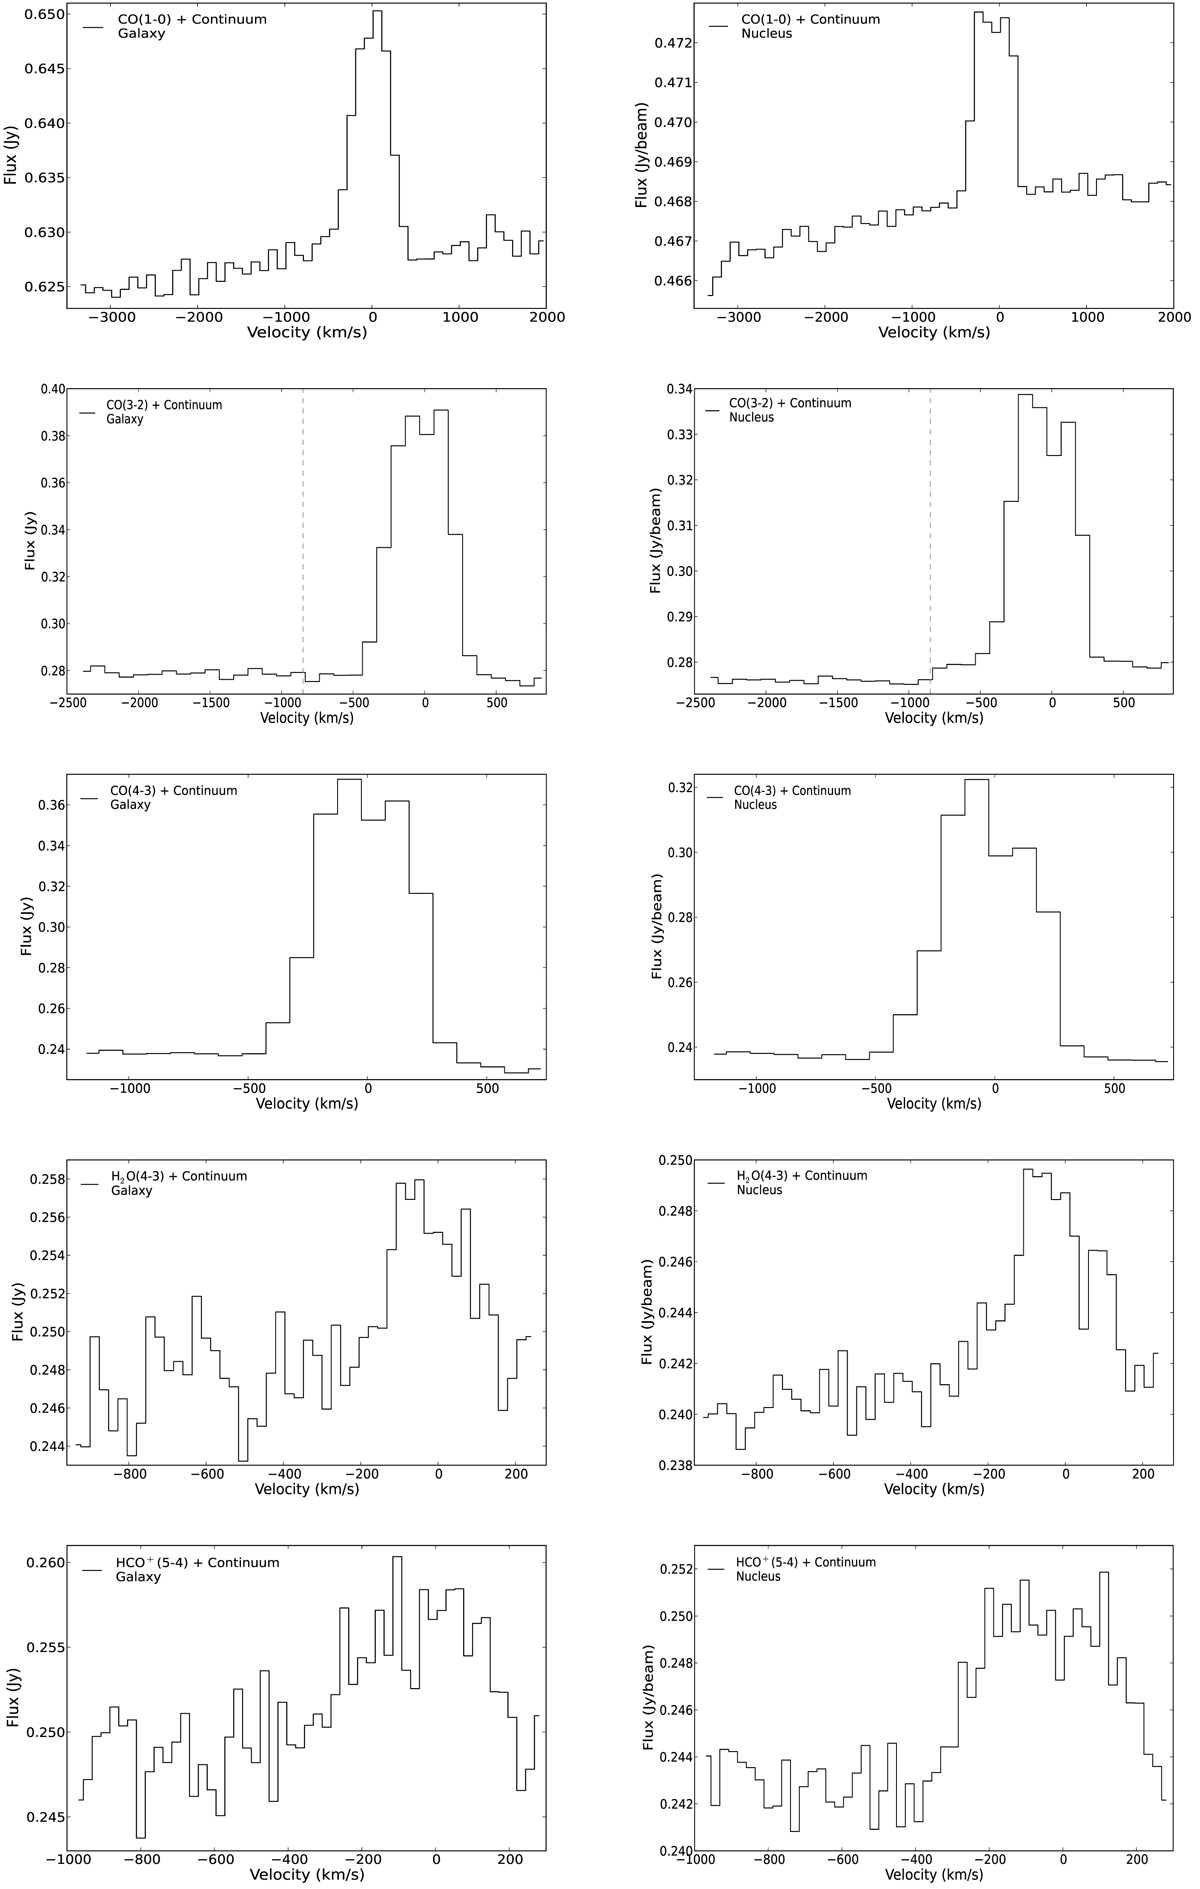
Spectra of all molecular gas lines and continuum emission detected in the ALMA data of the program 2013.1.00180.S. Left: spectra of the entire galaxy. Right: spectra of the nuclear pixel. The dashed line in CO(3−2) spectrum corresponds to the frequency at which the stitching of the data of the two spectral windows, in which the continuum level and slope are not known with sufficient accuracy for the determination of the presence of a wind, took place.
Current usage metrics show cumulative count of Article Views (full-text article views including HTML views, PDF and ePub downloads, according to the available data) and Abstracts Views on Vision4Press platform.
Data correspond to usage on the plateform after 2015. The current usage metrics is available 48-96 hours after online publication and is updated daily on week days.
Initial download of the metrics may take a while.