Fig. 16.
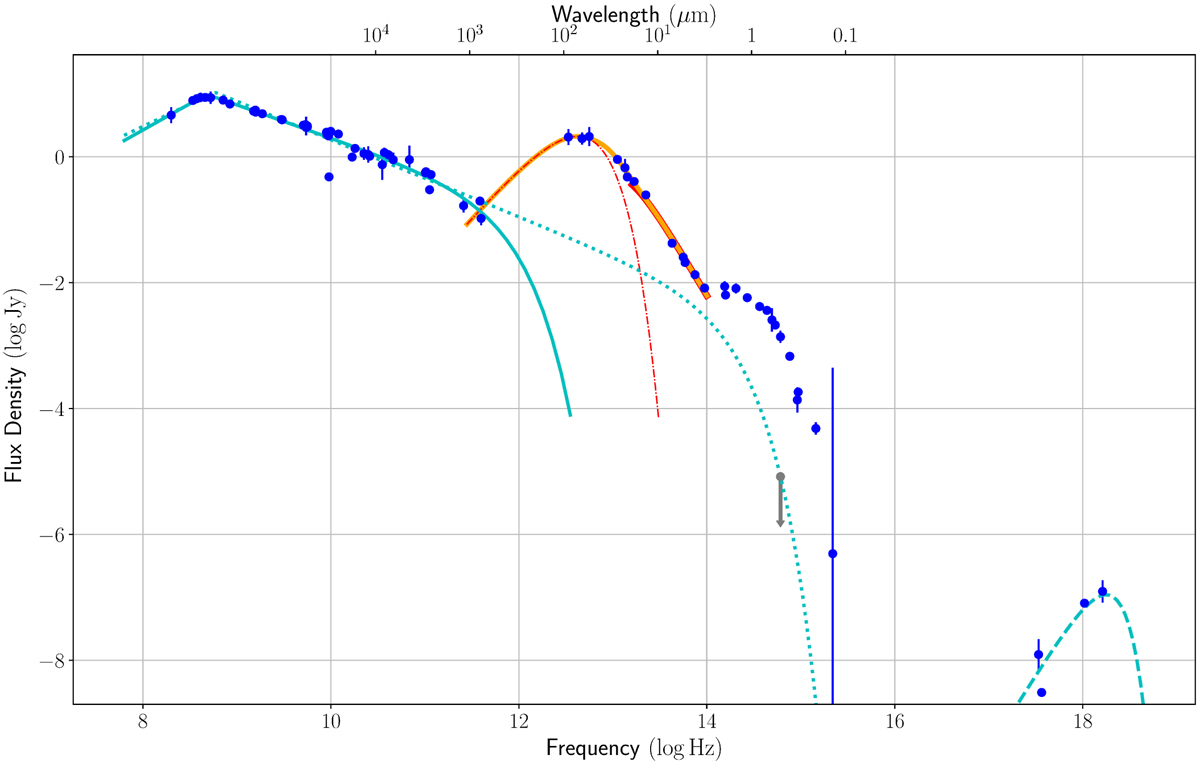
Fit of the spectral energy distribution of 4C12.50. The infrared part of the spectrum was fit with a modified black body at long wavelengths (red dashed-dotted line) and with a power-law representing a series of modified black bodies at short wavelengths (red thick line). The total infrared model is plotted with a solid orange line. A broken power-law approximation with exponential cutoff is used for the radio emission. Minimum and maximum synchrotron flux models are given for the radio to optical range (solid cyan curve and dotted cyan curve, respectively; see the text for more details). A maximum model for the inverse Compton emission in the X-rays is shown with a dashed line.
Current usage metrics show cumulative count of Article Views (full-text article views including HTML views, PDF and ePub downloads, according to the available data) and Abstracts Views on Vision4Press platform.
Data correspond to usage on the plateform after 2015. The current usage metrics is available 48-96 hours after online publication and is updated daily on week days.
Initial download of the metrics may take a while.