Fig. 12.
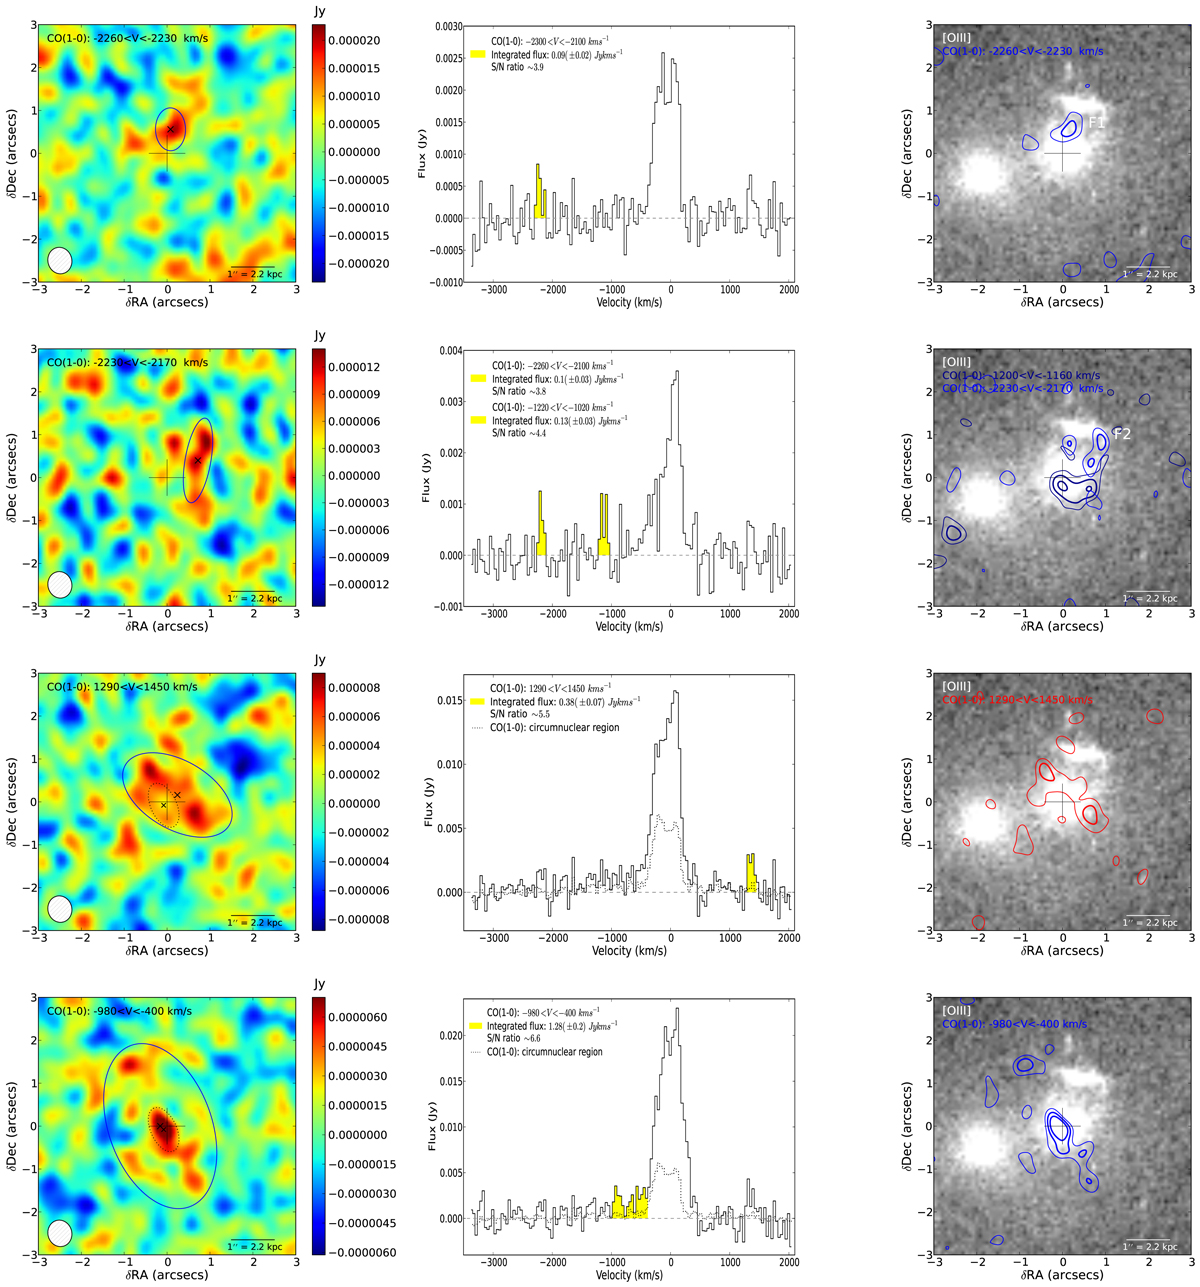
Tentative CO detections of high-velocity clouds in directions radially extending from the main nucleus to outer parts of the galaxy. The contour levels in the right panels are: 2σ, 3σ and 4σ. In the last two panels, the solid-line and the dotted spectra (middle) correspond to the emission of the solid-line and the dotted ellipses (left), respectively. The latter marks the extent of the nuclear wind which is shown in Fig. 11.
Current usage metrics show cumulative count of Article Views (full-text article views including HTML views, PDF and ePub downloads, according to the available data) and Abstracts Views on Vision4Press platform.
Data correspond to usage on the plateform after 2015. The current usage metrics is available 48-96 hours after online publication and is updated daily on week days.
Initial download of the metrics may take a while.