Fig. 1.
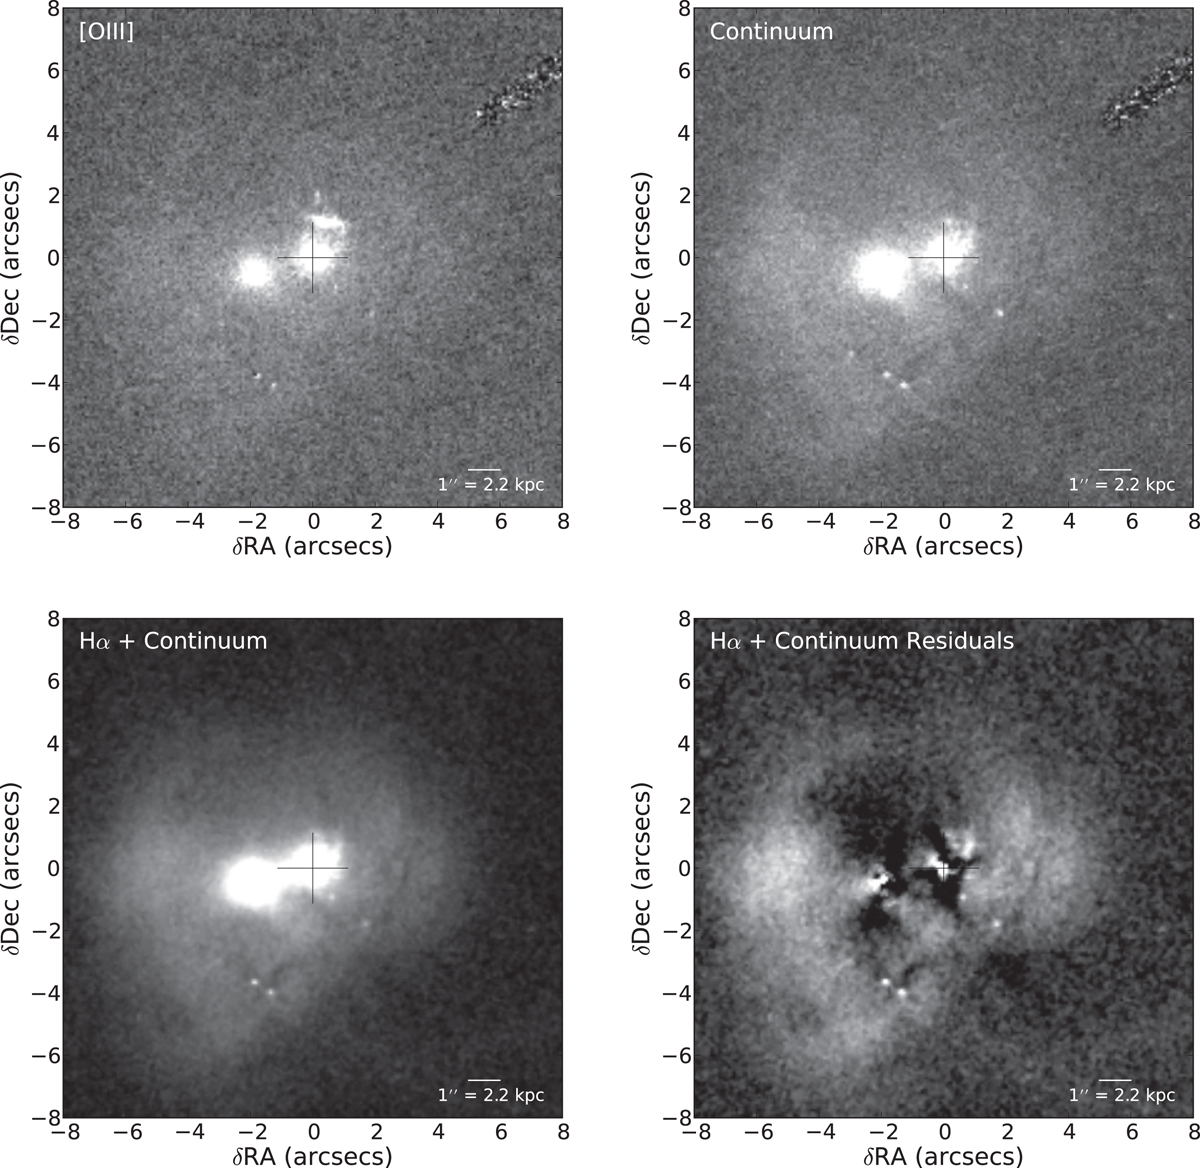
Optical images of 4C12.50 from the Hubble Space Telescope, previously presented by Batcheldor et al. (2007) and Dasyra et al. (2011). The crosses mark the location of the peak continuum emission in the ALMA band 3 data. The same applies to all following figures with the crosses. Upper left: gas emission comprising primarily [O III] emission with potential contribution from Hβ. The image was created from the subtraction of a Hubble Space Telescope ACS image at 5092 Å (filter FR459M) from an ACS image at 5580 Å (filter F550M). Upper right: continuum emission at 5092 Å (filter FR459M). Lower left: Hα and continuum emission (filters FR647M at 6616 Å). Lower right: residual image originating from the subtraction of galactic component models (i.e., a bulge and two disks) from an optical Hubble Space Telescope image of Hα and 5900 Å continuum emission (Batcheldor et al. 2007) using GALFIT (Peng et al. 2002). The subtraction method was described in detail in Dasyra et al. (2011). Its purpose was to bring up any structures underlying the bright regular emission.
Current usage metrics show cumulative count of Article Views (full-text article views including HTML views, PDF and ePub downloads, according to the available data) and Abstracts Views on Vision4Press platform.
Data correspond to usage on the plateform after 2015. The current usage metrics is available 48-96 hours after online publication and is updated daily on week days.
Initial download of the metrics may take a while.