Fig. 3.
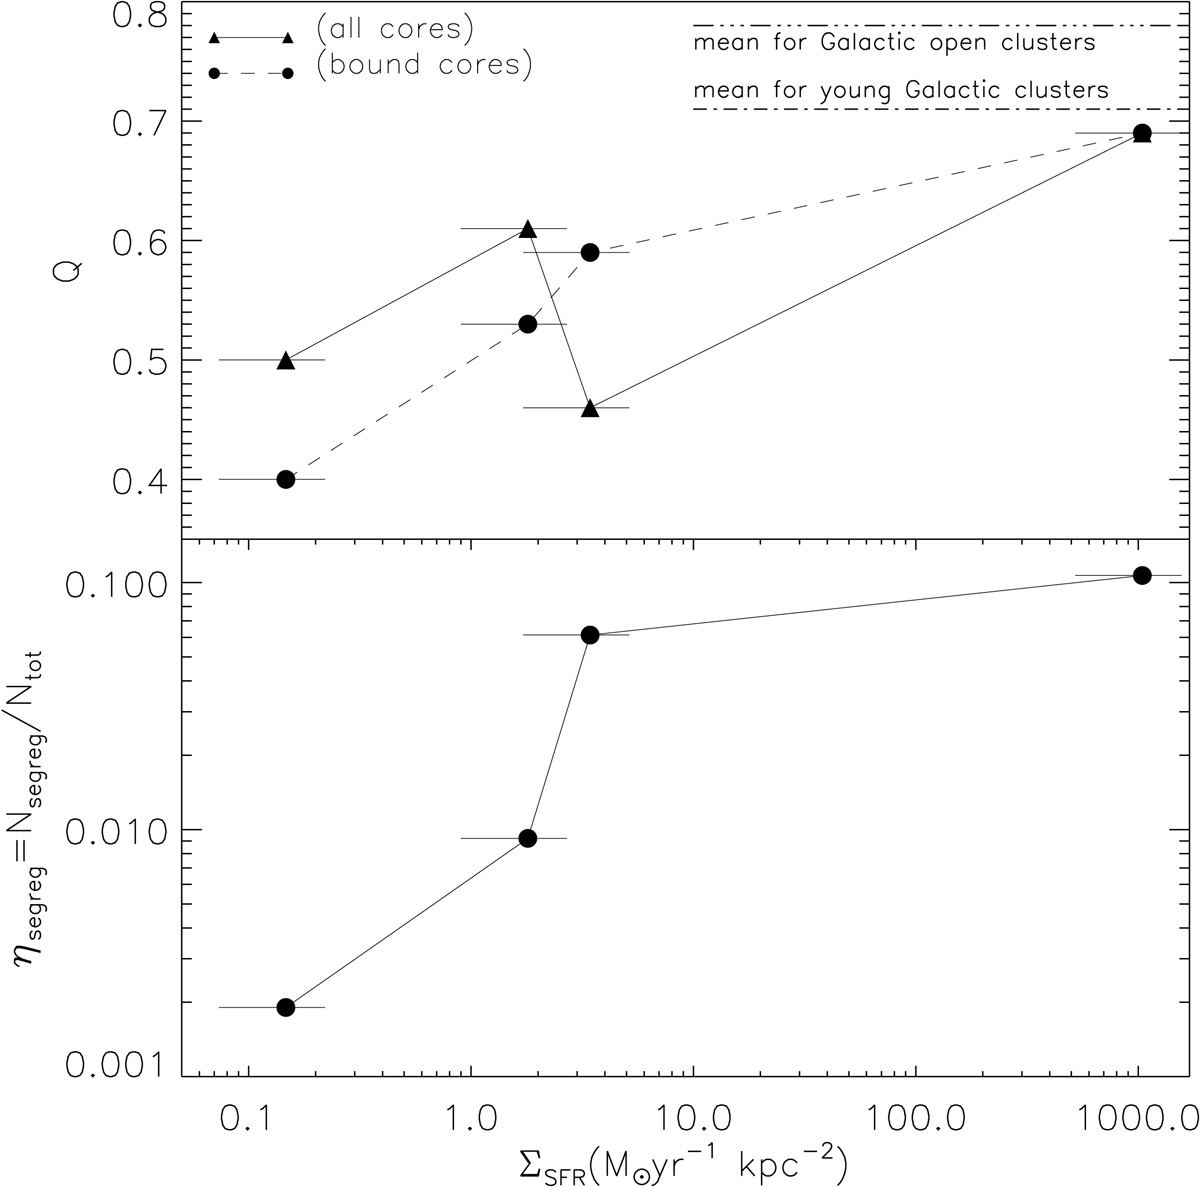
Correlation between the structure parameter, 𝒬 for the entire and bound populations of cores (dashed and full lines, respectively) versus the surface density of star formation ΣSFR (top panel) and the correlation between the ratio of the most segregated massive cores to the total number of cores and the ΣSFR. The horizontal error bars are the 50% uncertainties estimates that are likely to be affecting the measurements of ΣSFR. The values of 𝒬 = 0.78 and 0.71 are the ones measured by Dib et al. (2018) for the populations of open clusters and young clusters in the Milky Way, respectively. The estimate of ΣSFR for W43 is made using a different approach than for the other three regions (see text for details). The lines connecting the different sets of points are merely shown to guide the eye.
Current usage metrics show cumulative count of Article Views (full-text article views including HTML views, PDF and ePub downloads, according to the available data) and Abstracts Views on Vision4Press platform.
Data correspond to usage on the plateform after 2015. The current usage metrics is available 48-96 hours after online publication and is updated daily on week days.
Initial download of the metrics may take a while.