Fig. 2.
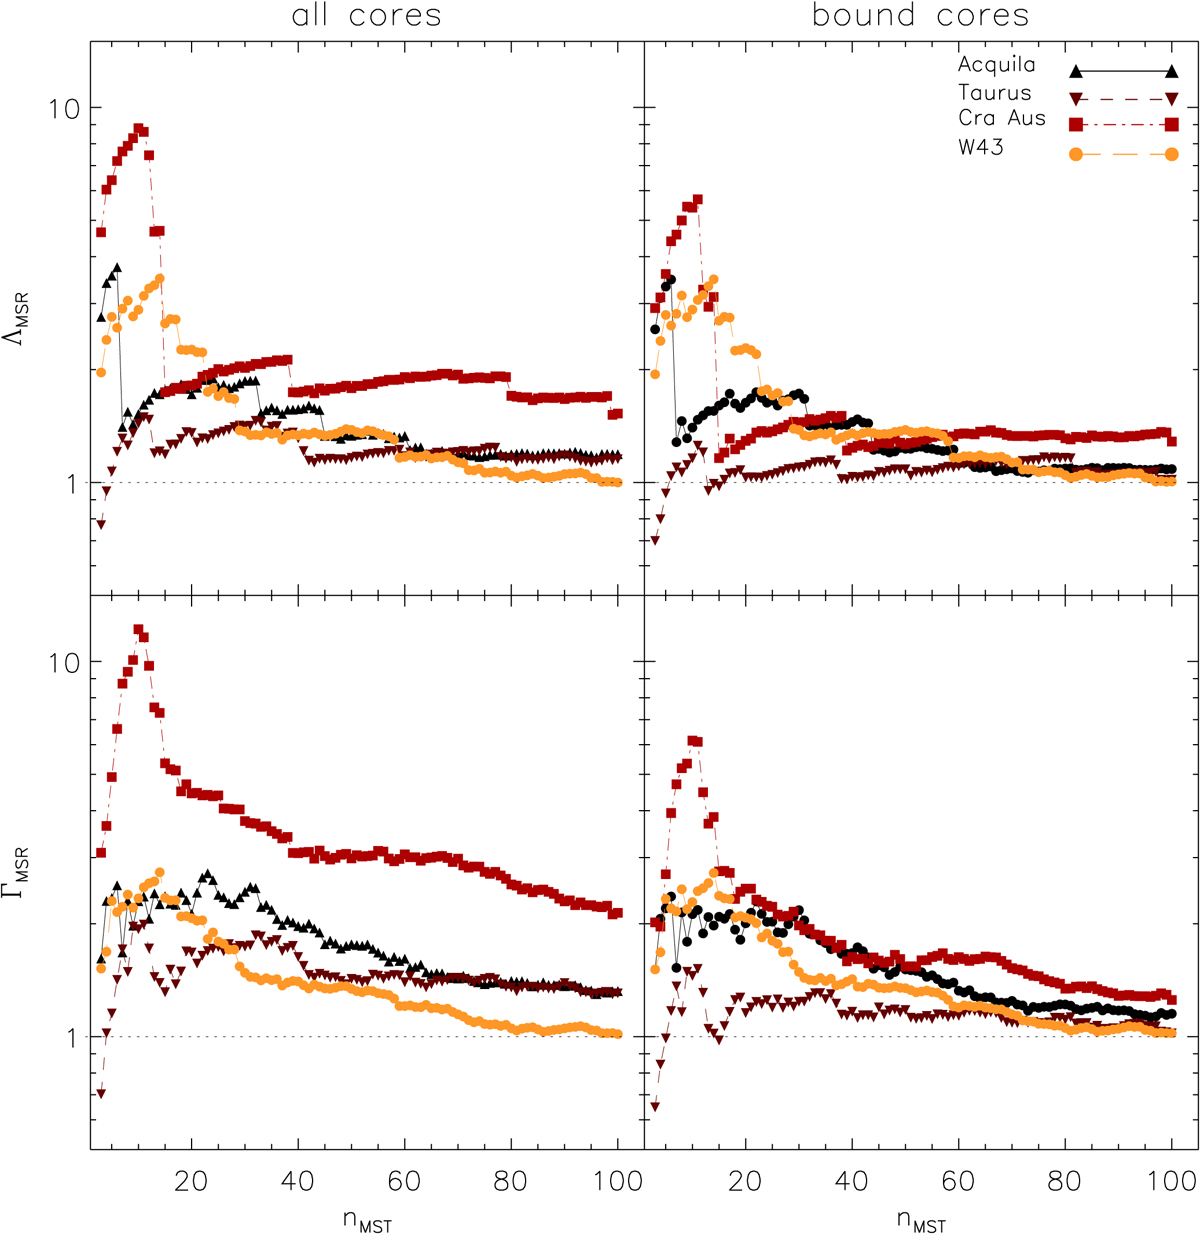
Mass segregation ratios ΛMSR (Allison et al. 2009, top row) and ΓMSR (Olczak et al. 2011, bottom row) as a function of the number of most massive cores used in computing them, nMST. The values of ΛMSR and ΓMSR are calculated for the entire population of cores in the star forming regions (left column) and for the populations of bound cores (prestellar cores and cores with a protostar). A version of this figure that includes estimates of the uncertainties on ΛMSR and ΓMSR for each individual region is shown in Fig. B.1.
Current usage metrics show cumulative count of Article Views (full-text article views including HTML views, PDF and ePub downloads, according to the available data) and Abstracts Views on Vision4Press platform.
Data correspond to usage on the plateform after 2015. The current usage metrics is available 48-96 hours after online publication and is updated daily on week days.
Initial download of the metrics may take a while.