Fig. 1.
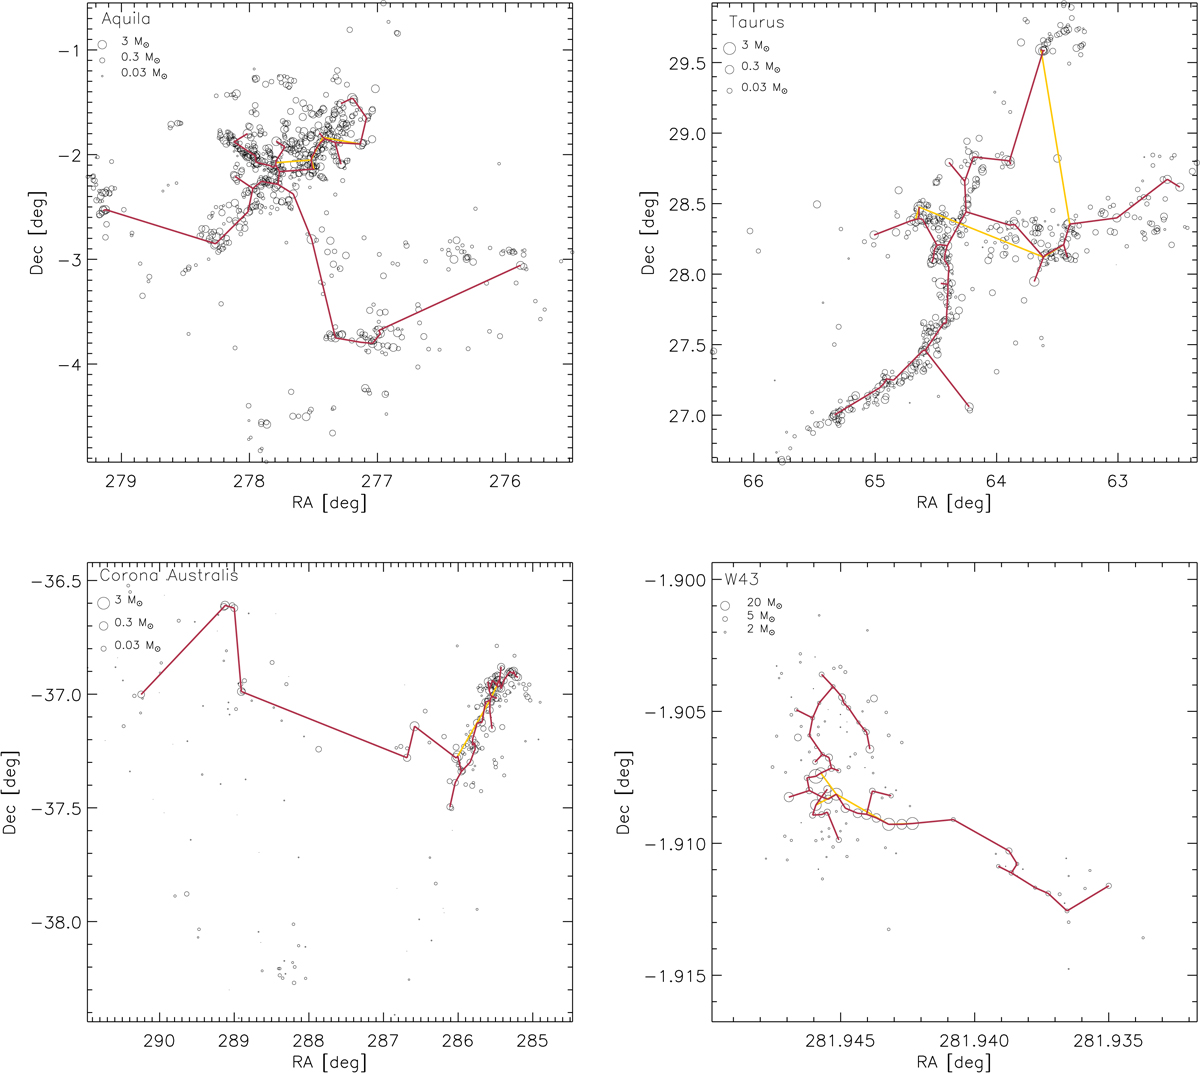
Spatial distribution of dense cores in the four star forming regions considered in this work. The sizes of cores have been scaled (with an arbitrary formula) according to their masses (i.e., larger sizes relate to more massive cores) in order to visually highlight the location of the most massive cores. The minimum spanning tree for the ensemble of the 6 and 50 most massive cores in each region are displayed with the yellow and purple lines, respectively.
Current usage metrics show cumulative count of Article Views (full-text article views including HTML views, PDF and ePub downloads, according to the available data) and Abstracts Views on Vision4Press platform.
Data correspond to usage on the plateform after 2015. The current usage metrics is available 48-96 hours after online publication and is updated daily on week days.
Initial download of the metrics may take a while.