Fig. 1
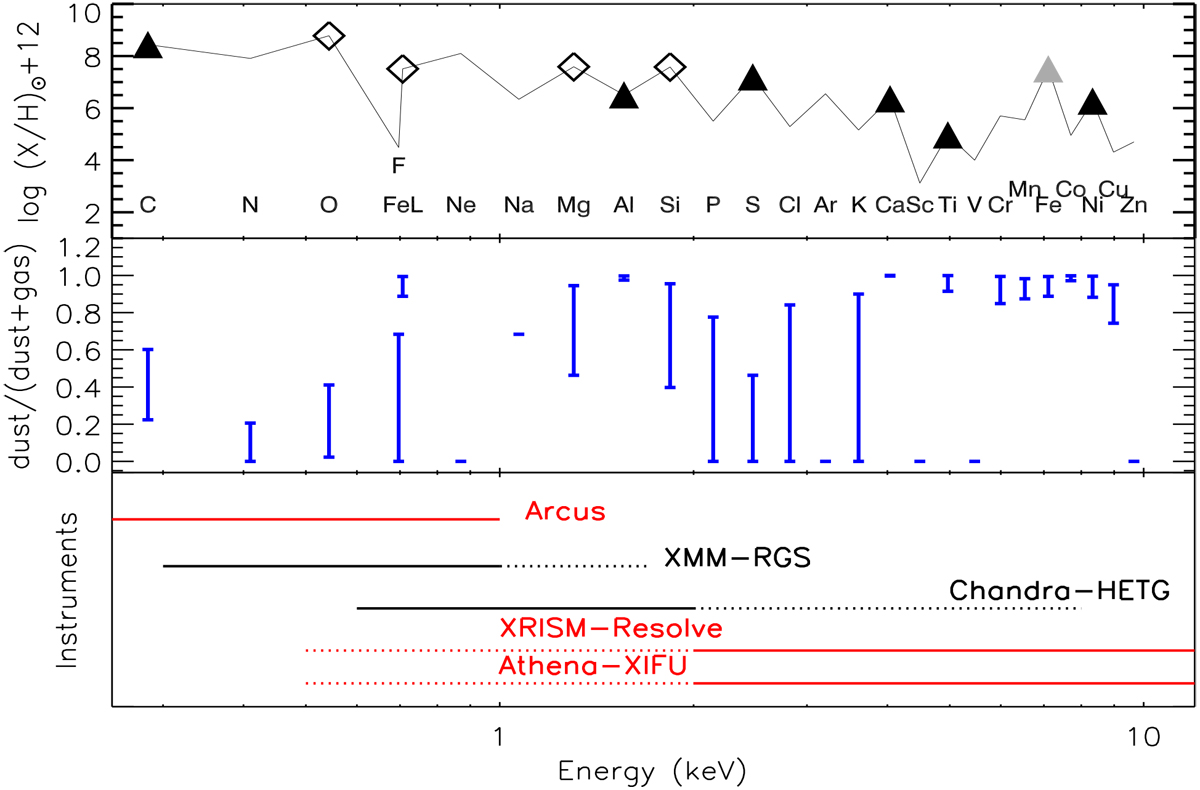
Top panel: abundance pattern as a function of energy for the absorbing elements in the X-ray band. The K-edge energy is indicated, except from Fe, for which both the K and the L edges, at 7.1 and ~0.7 keV, respectively, can be studied. Abundances follow Lodders (2010) and they are expressed in terms of log (X/H)+12. In this frame, the abundance of hydrogen is 12. The open diamonds indicate the elements that are accessible by current instruments. The triangles indicate the relevant elements that will be accessible by future instruments to study dust. The black triangles indicate the subject of this work. Middle panel: range of depletions as reported by Jenkins (2009) for all elements, except C (Jenkins 2009; Whittet 2003), F (Snow et al. 2007), Na (Turner 1991), S (Gry & Jenkins 2017), K (Snow 1975), Ca (Crinklaw et al. 1994), Co (Federman et al. 1993), Al (Jenkins & Wallerstein 1996), and Ar (Sofia & Jenkins 1998). Bottom panel: energy range covered by present and future (red)mission. The solid line highlights the energy range for which the instruments capabilities are optimal for observing absorption by dust.
Current usage metrics show cumulative count of Article Views (full-text article views including HTML views, PDF and ePub downloads, according to the available data) and Abstracts Views on Vision4Press platform.
Data correspond to usage on the plateform after 2015. The current usage metrics is available 48-96 hours after online publication and is updated daily on week days.
Initial download of the metrics may take a while.