Fig. 2.
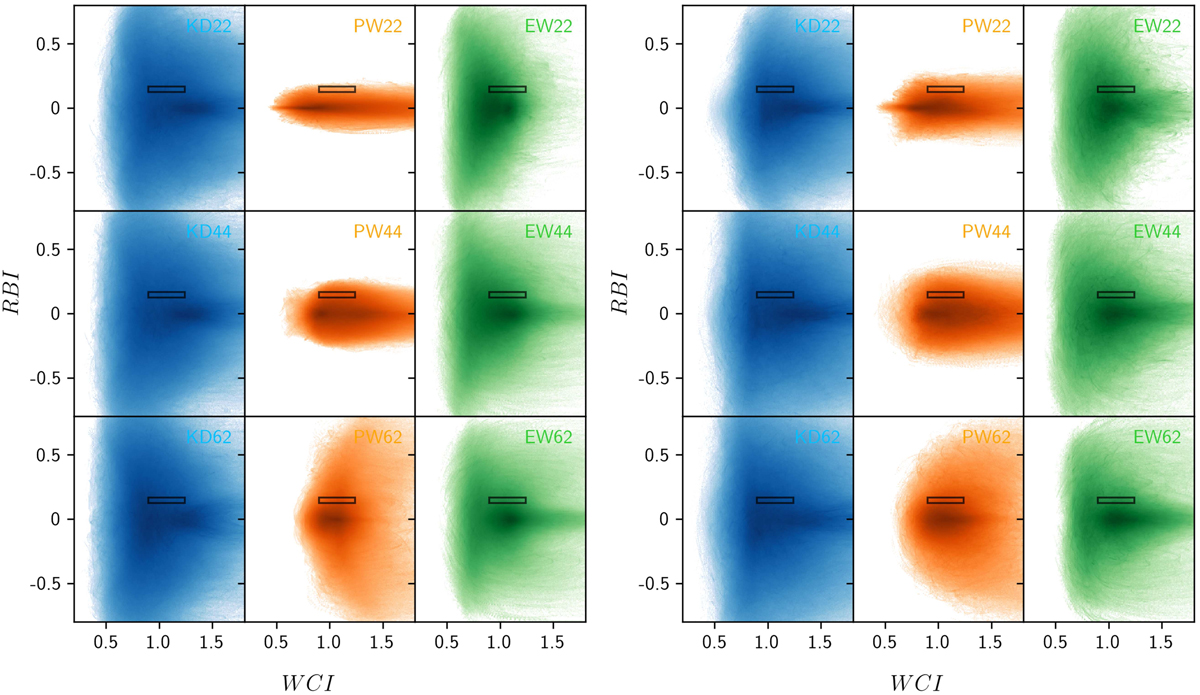
Two-dimensional histograms of simulated (WCI,RBI). These indices were measured from simulated line profiles that arise from the BLR models KD, PW, and EW seen at inclinations 22°, 44°, and 62°. The BLR models that have an emissivity ϵ0 (rin/r)q that sharply decreases with radius, i.e., q = 3, are illustrated in the left panel, while those characterized by a slowly decreasing emissivity, i.e., q = 1.5, are illustrated in the right panel. Each model also contains a continuum-emitting disk seen under the same inclination. All continuum source radii and BLR sizes used in the simulations are considered but only the models that reproduce the measured μcont and μBLR values are shown, i.e., 1.58 ≤ μcont ≤ 1.78 and 1.13 ≤ μBLR ≤ 1.47. The color map is logarithmic. The measured WCI and RBI values with their uncertainties are plotted as a small grey rectangle superimposed on the simulated (WCI,RBI) distributions.
Current usage metrics show cumulative count of Article Views (full-text article views including HTML views, PDF and ePub downloads, according to the available data) and Abstracts Views on Vision4Press platform.
Data correspond to usage on the plateform after 2015. The current usage metrics is available 48-96 hours after online publication and is updated daily on week days.
Initial download of the metrics may take a while.