Free Access
Fig. 8
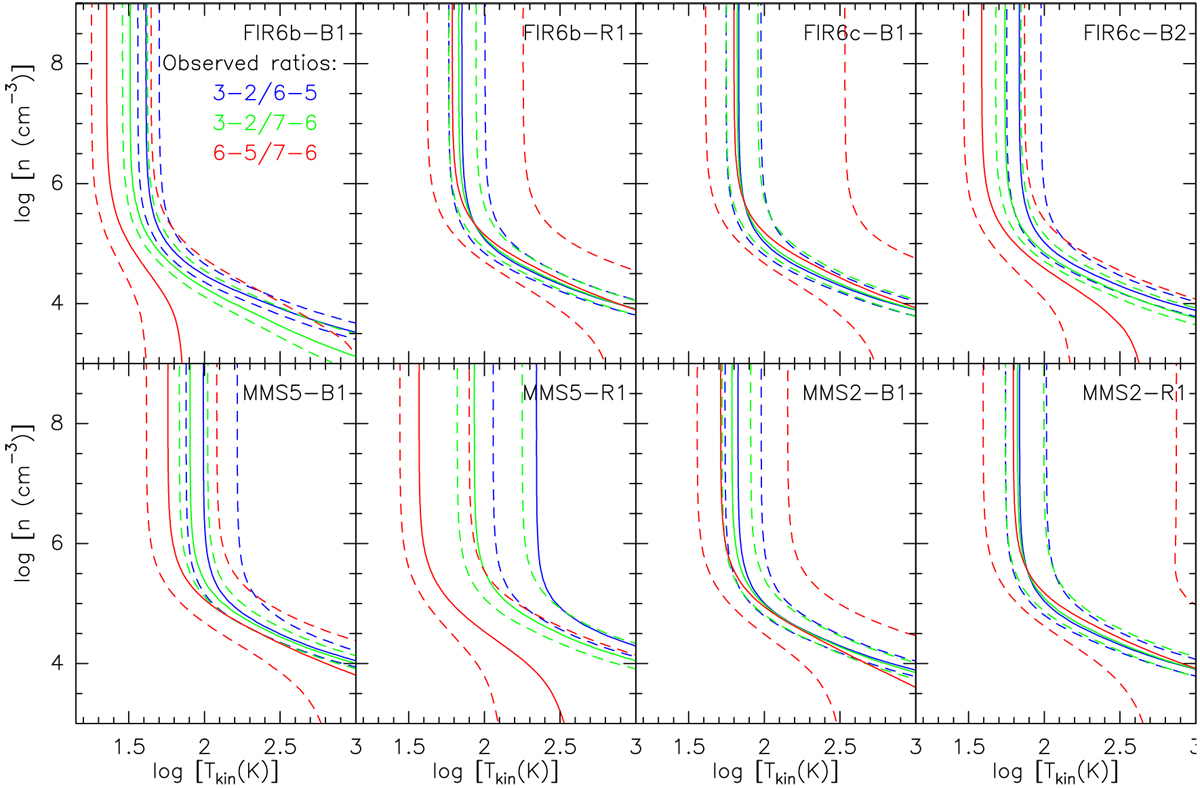
Kinetic temperature (Tkin) versus H2 density (n) plots from LVG calculations. The curves show the observed (3–2)/(6–5), (3–2)/(7–6), and (6–5)/(7–6) integrated intensity ratios (computed from Table 5). The dashed lines represent the errors in the line ratios. The positions are indicated by the labels in each panel.
Current usage metrics show cumulative count of Article Views (full-text article views including HTML views, PDF and ePub downloads, according to the available data) and Abstracts Views on Vision4Press platform.
Data correspond to usage on the plateform after 2015. The current usage metrics is available 48-96 hours after online publication and is updated daily on week days.
Initial download of the metrics may take a while.