Fig. 7
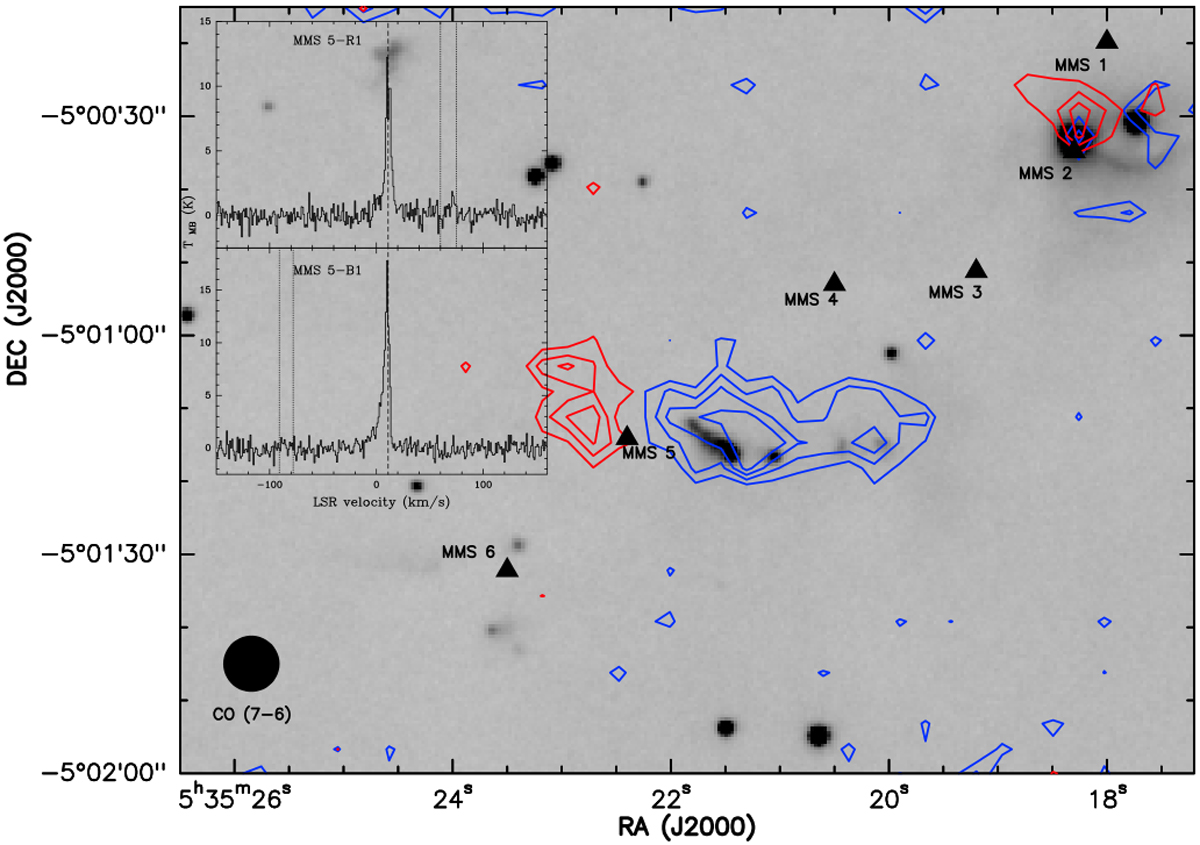
CO (7–6) high-velocity emission map centered on MMS 5. Blue and red contours show the blue- and red-shifted high-velocity emission (integrated in the same velocity ranges as in Fig. 2), respectively. Contour spacing is 1σ, with 3σ as the first contour (σ = 7.4 K km s−1 for blue-shifted emission and σ = 6.7 K km s−1 for red-shifted emission). The background greyscale image is as in Fig. 4, the filled triangles as in Fig. 2. The inlay shows the CO (7–6) spectrum taken at the B1 and R1 positions, with the vertical lines as in Fig. 6.
Current usage metrics show cumulative count of Article Views (full-text article views including HTML views, PDF and ePub downloads, according to the available data) and Abstracts Views on Vision4Press platform.
Data correspond to usage on the plateform after 2015. The current usage metrics is available 48-96 hours after online publication and is updated daily on week days.
Initial download of the metrics may take a while.