Fig. 6
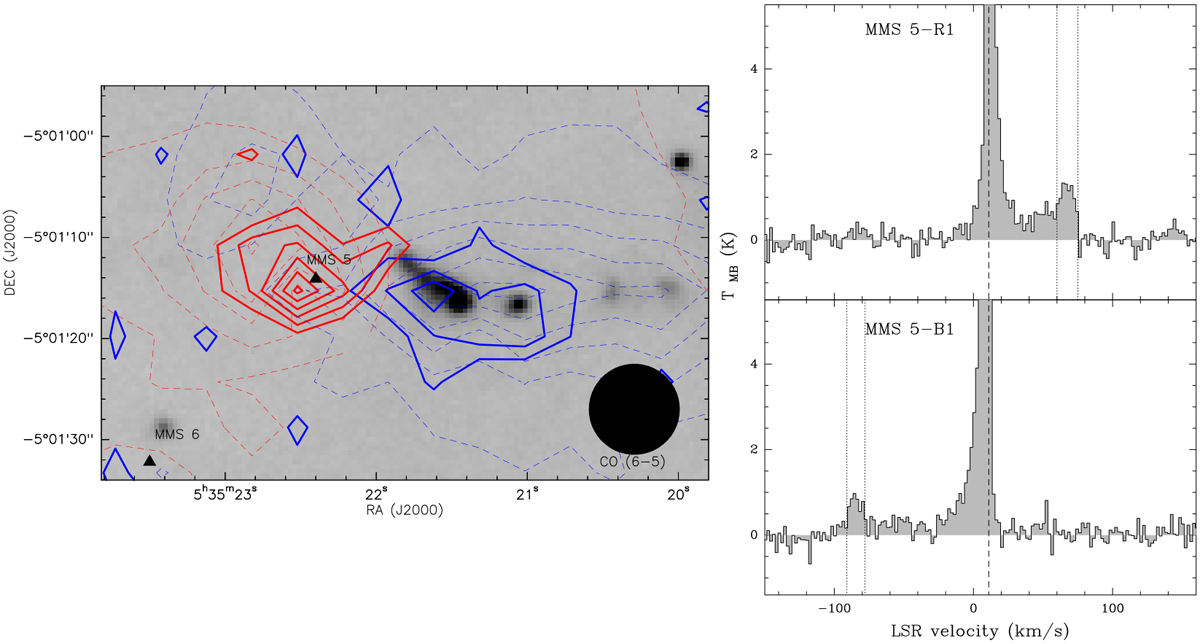
Left: EHV CO (6–5) emission from MMS 5 outflow. The solid blue contours show the CO (6–5) emission integrated from VLSR = − 91 to −78 km s−1 (blue-shifted EHV range), while the solid red contours show the CO (6–5) emission integrated from VLSR = 60–75 km s−1 (red-shifted EHV range). The first contour is 3σ, with contourspacing in steps of σ (2.2 K km s−1). The dashed contours show the high-velocity CO (6–5) emission as presented in Fig. 2. The background greyscale image is the NIR (K-band, 2.12 μm) map taken from T08. Right: CO (6–5) spectrum taken at the B1 and R1 positions (see Table 3). The vertical dot-dashed lines show the boundaries of the EHV range, while the dashed line indicates the cloud velocity.
Current usage metrics show cumulative count of Article Views (full-text article views including HTML views, PDF and ePub downloads, according to the available data) and Abstracts Views on Vision4Press platform.
Data correspond to usage on the plateform after 2015. The current usage metrics is available 48-96 hours after online publication and is updated daily on week days.
Initial download of the metrics may take a while.