Fig. 2
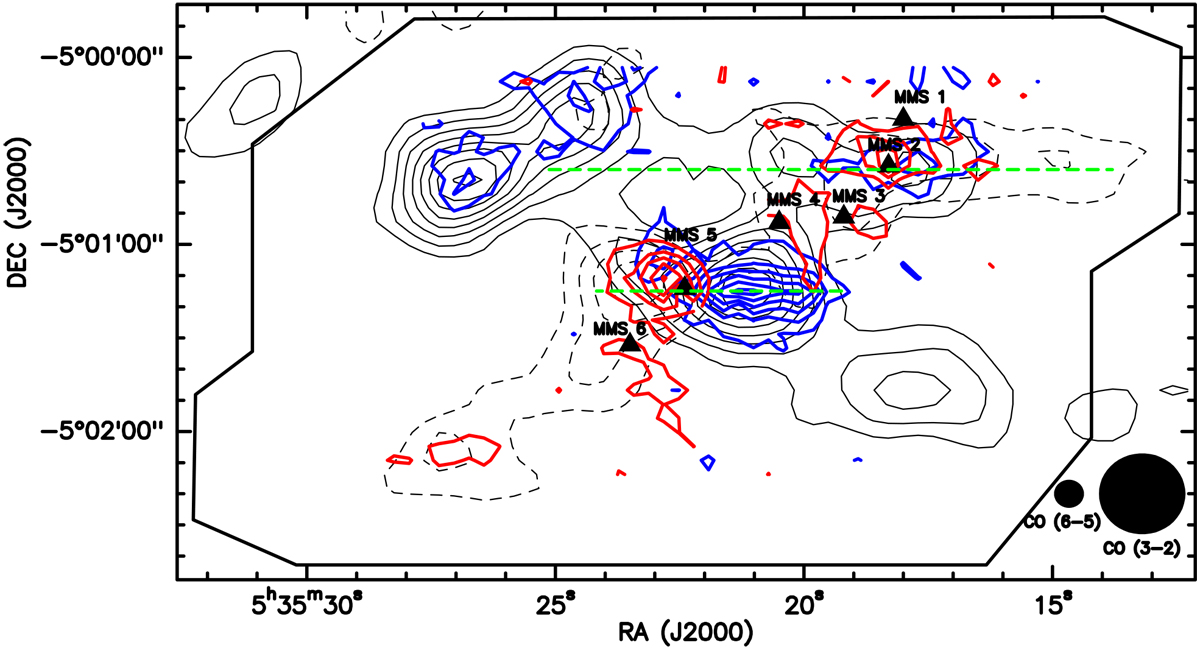
CO (6–5) outflow emission in the OMC-3 MMS 1–6 region. Blue contours are for the blue-shifted emission in the range from −25 to +7 km s−1; while red contours are for the red-shifted emission from +16 to +31 km s−1. The first contour is 3σ and contour spacing is 2σ (σ = 1.9 and 0.8 K km s−1, for blue- and red-shifted emission, respectively). The black solid and dashed contours are the blue- and red-shifted CO (3–2) emission, respectively, as presented by T08. The black square shows the whole field covered by our CHAMP+ observations. The triangles show the positions of the continuum sources and the green dashed lines indicate the outflow orientation (both according to T08).
Current usage metrics show cumulative count of Article Views (full-text article views including HTML views, PDF and ePub downloads, according to the available data) and Abstracts Views on Vision4Press platform.
Data correspond to usage on the plateform after 2015. The current usage metrics is available 48-96 hours after online publication and is updated daily on week days.
Initial download of the metrics may take a while.