Fig. 5.
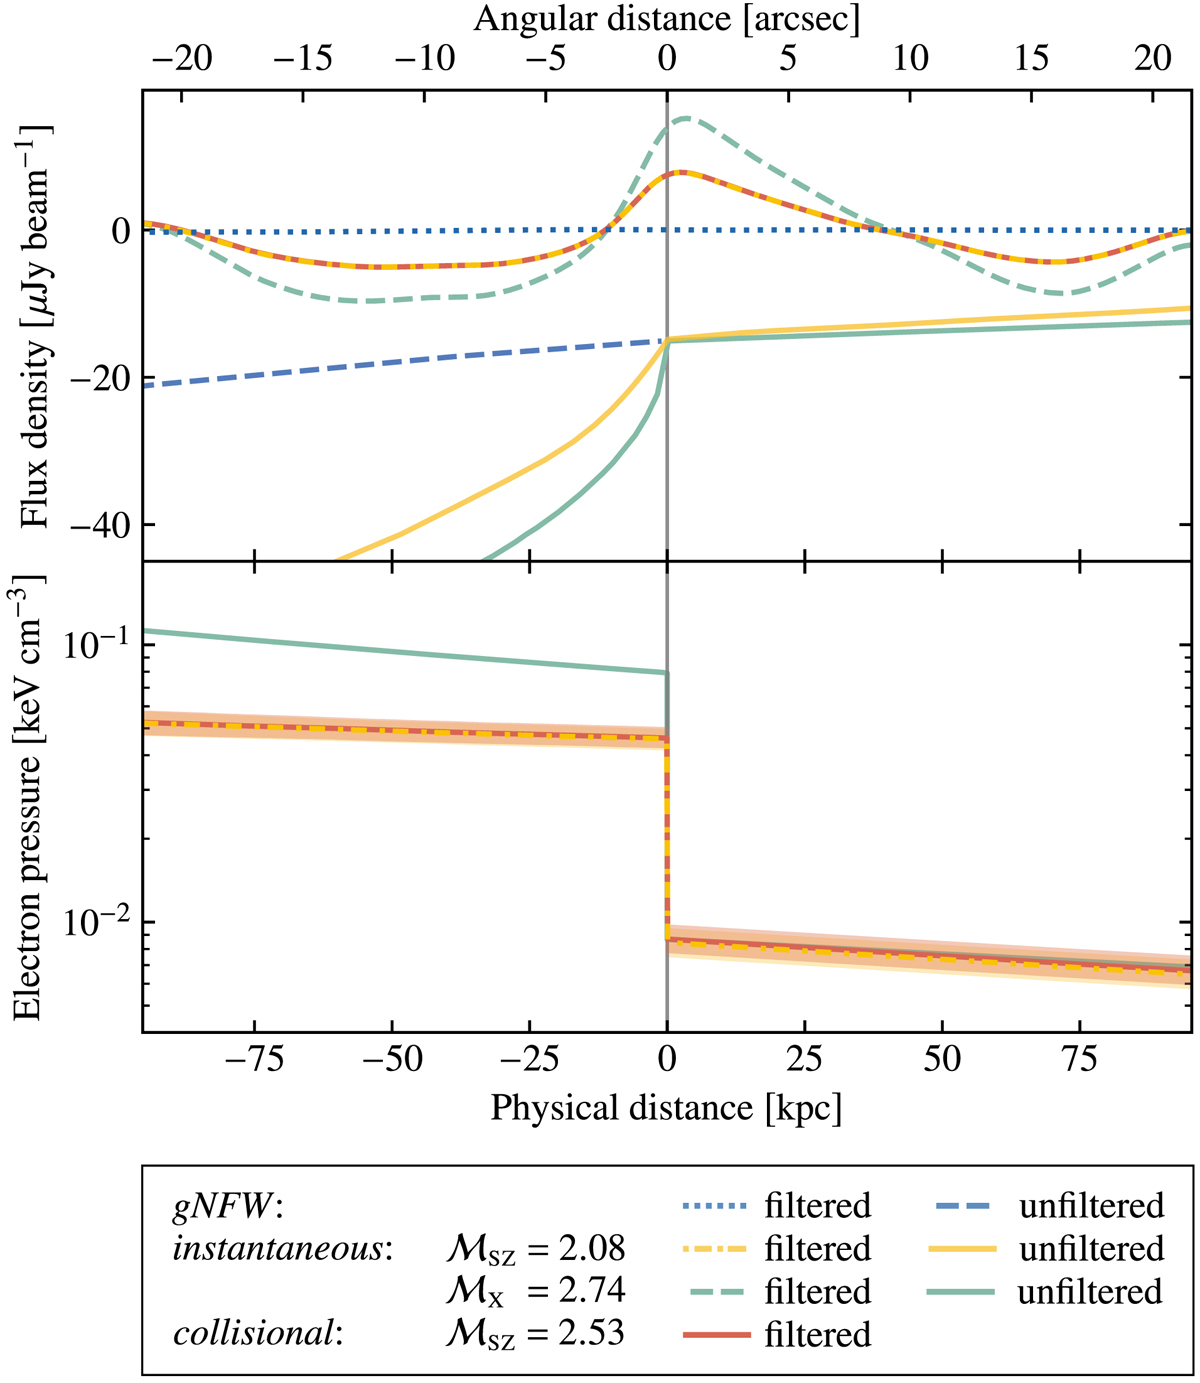
Comparison of SZ signal profiles (upper panel) and the corresponding electron pressure profiles (lower panel) across the shock nose. The vertical gray line denotes the position of the shock front. We note that the upper panel contains both unfiltered input model fits for the SZ signal and the corresponding filtered (observed) profiles (see legend for details). As discussed in Sect. 3.2, the instantaneous (dash-dotted yellow) and collisional (solid red) shock models are indistinguishable after the spatial filtering of the interferometric ALMA+ACA observation, reflecting the fundamental limitation of ALMA+ACA to constrain any large-scale (≳1′) component of the SZ signal. Again, we note that while we measure a decrement due to the SZ effect, the filtered (observed) profiles can exhibit both positive and negative excursions (analogous to the Gibbs phenomenon; see, e.g., Bracewell 1978). For comparison, we also report the input unfiltered model (solid yellow) for the instantaneous equilibration, and both the raw and filtered underlying gNFW profile (dashed and dotted blue lines, as noted in the legend). We also present the X-ray expectation for both the filtered and raw SZ signal profiles (dashed and solid green lines) and corresponding pressure profiles that we would expect for the case of instantaneous equilibration, using the value ℳX = 2.74 ± 0.25 derived from fits to the X-ray data.
Current usage metrics show cumulative count of Article Views (full-text article views including HTML views, PDF and ePub downloads, according to the available data) and Abstracts Views on Vision4Press platform.
Data correspond to usage on the plateform after 2015. The current usage metrics is available 48-96 hours after online publication and is updated daily on week days.
Initial download of the metrics may take a while.