Fig. 4.
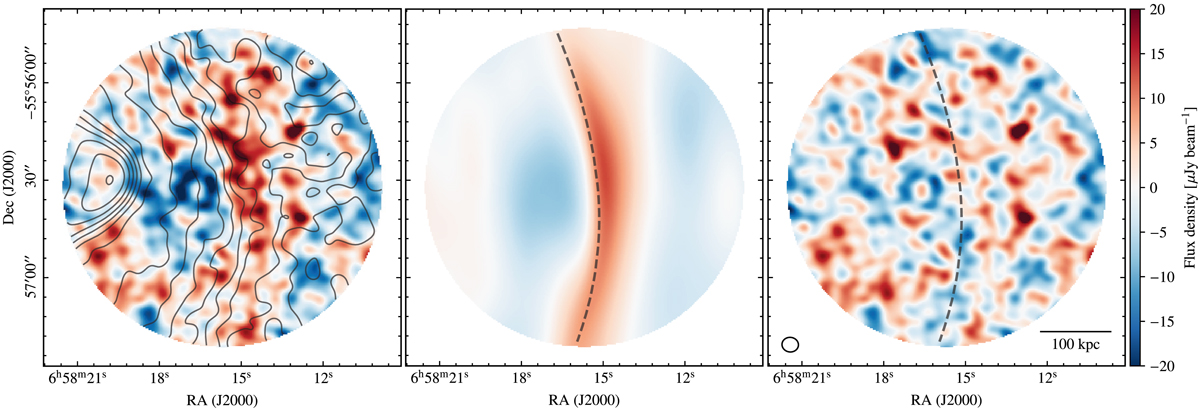
Dirty images of the raw (left), model (middle), and residual (right) ALMA+ACA interferometric data. They are generated by jointly gridding the ACA and ALMA data using a multi-frequency natural weighting scheme. For reference, this provides a synthesized beam of 4.07″ × 3.01″ FWHM (PA 81°; bottom-left corner of right panel). We cut off the fields at the 0.2 gain level of the joint ALMA+ACA antenna pattern. To better highlight the large-scale shock features, we avoid correcting for the primary beam attenuation and apply an additional 30 kλ taper. We note that the model subtraction is performed directly in Fourier space. The dashed line in the center and right panels indicate the inferred position of the shock front. X-ray contours are overlaid on the left panel from Fig. 1. We also note the positive signal at the shock front is not due to an increment of the SZ signal; rather it is an artifact of the high-pass filtering effects of ALMA+ACA (see also Fig. 5).
Current usage metrics show cumulative count of Article Views (full-text article views including HTML views, PDF and ePub downloads, according to the available data) and Abstracts Views on Vision4Press platform.
Data correspond to usage on the plateform after 2015. The current usage metrics is available 48-96 hours after online publication and is updated daily on week days.
Initial download of the metrics may take a while.