Fig. 2.
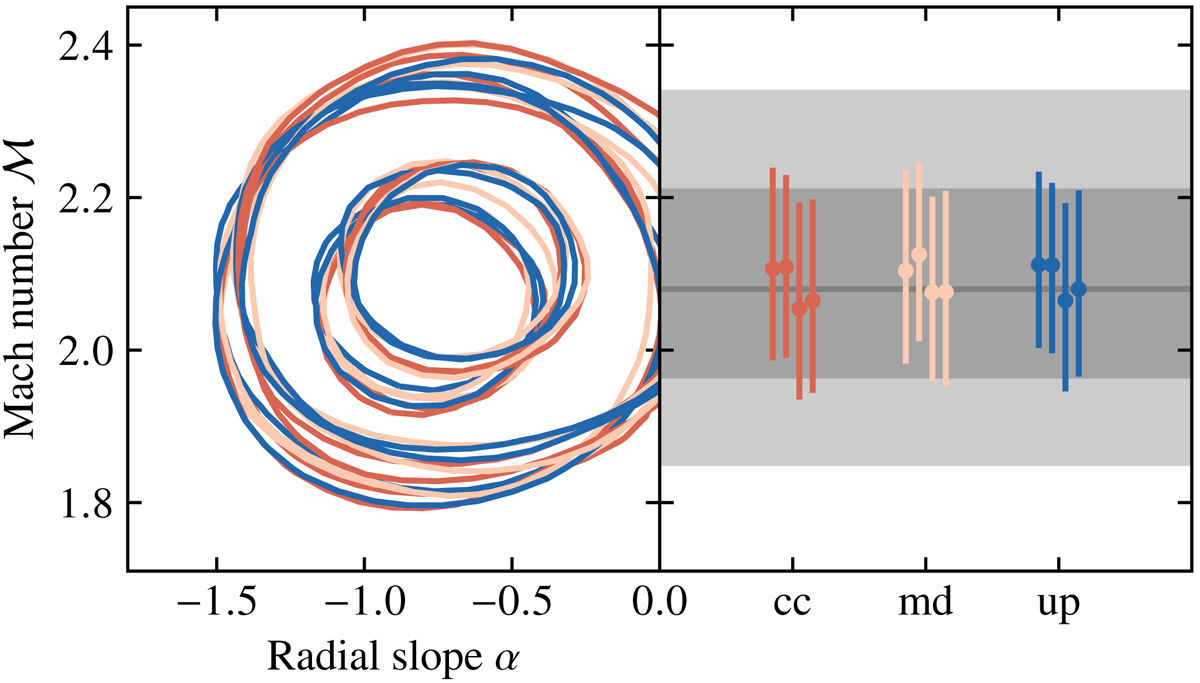
Bivariate posterior density function (left panel) for the inferred Mach number ℳ and slope of the downstream pressure distribution α for a set of upstream pressure profiles and respective centroids. To facilitate comparison, the best-fitting ℳ estimates are also plotted (right panel). We consider three different cases for the underlying gNFW profile by setting the slopes equal to the values reported in Arnaud et al. (2010) for the cool-core (cc; red), morphologically-disturbed (md; peach), or ensemble (up; blue) cluster samples. For each of them, the distribution centroid is then fixed to a number of different positions: far downstream and far upstream (right panel, left and mid-left points), respectively to arbitrary distances of 10′ east and 3′ west of the X-ray-derived shock nose coordinates; APEX-SZ centroid (mid-right point; Halverson et al. 2009); peak of the κ-map (right point; Clowe et al. 2006). In all the above cases, we assumed instantaneous shock heating of the electrons. The gray line in the right panel denotes the corresponding best-fitting ℳ reported in Sect. 3.1, while the darker and lighter bands the respective 68% and 95% credibility intervals.
Current usage metrics show cumulative count of Article Views (full-text article views including HTML views, PDF and ePub downloads, according to the available data) and Abstracts Views on Vision4Press platform.
Data correspond to usage on the plateform after 2015. The current usage metrics is available 48-96 hours after online publication and is updated daily on week days.
Initial download of the metrics may take a while.