Fig. 1.
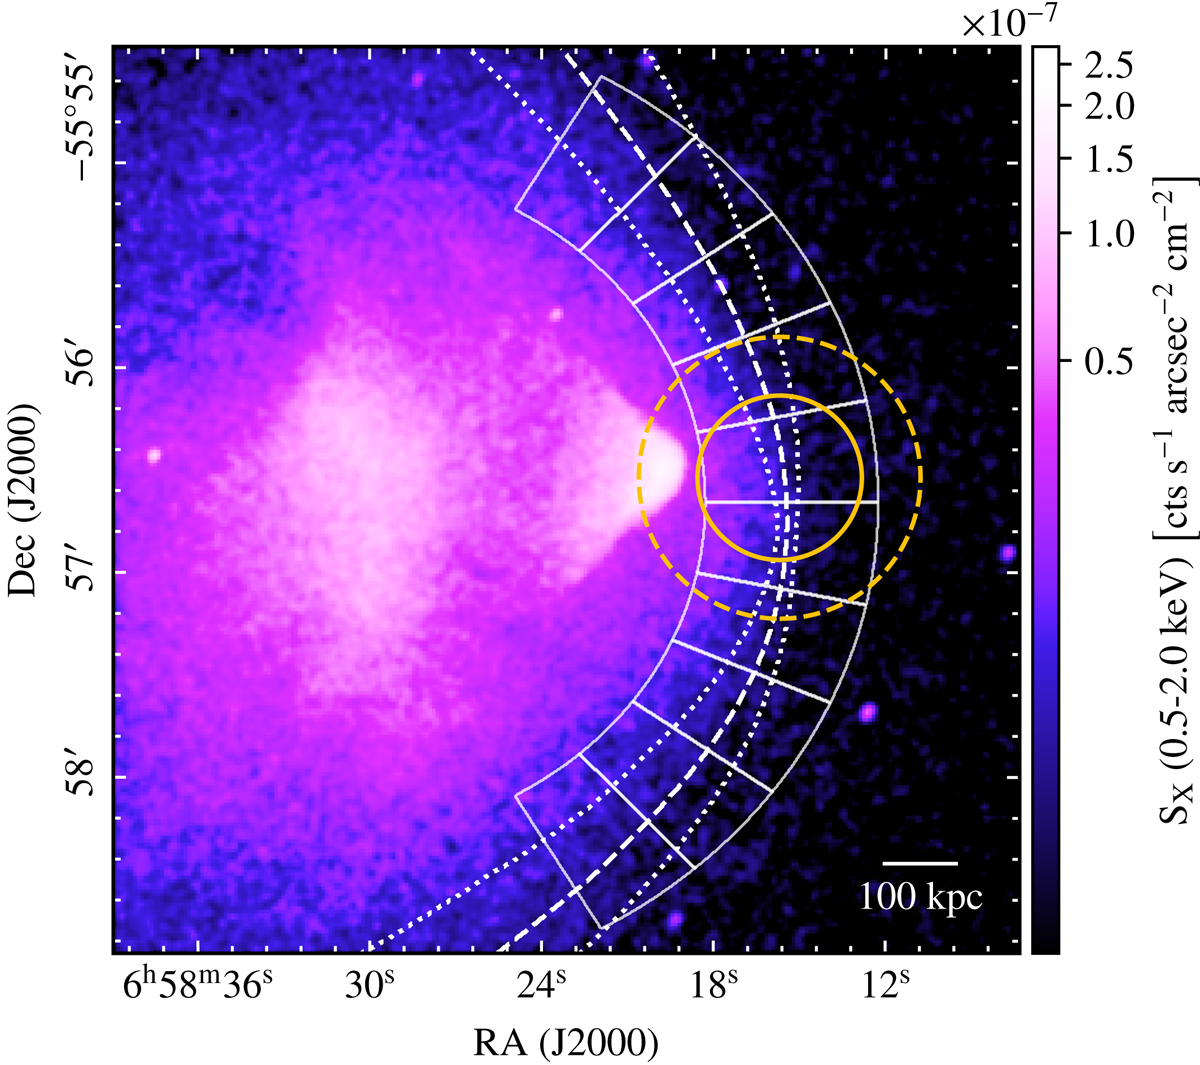
Cut-out of the 0.5−2.0 keV Chandra X-ray surface brightness map of the Bullet Cluster. The solid wedges represent the sectors employed to derive the hyperbolic shape best-matching the shock front geometry. The maximum-a-posteriori model is shown as a dashed line, while the dotted contours indicate the corresponding 95% credible interval. Further, the dashed and solid yellow circles denote respectively the ACA and ALMA full-width-at-half-maximum fields of view. For reference, the upstream and downstream gas lie respectively west (right) and east (left) of the shock front.
Current usage metrics show cumulative count of Article Views (full-text article views including HTML views, PDF and ePub downloads, according to the available data) and Abstracts Views on Vision4Press platform.
Data correspond to usage on the plateform after 2015. The current usage metrics is available 48-96 hours after online publication and is updated daily on week days.
Initial download of the metrics may take a while.