Fig. B.2.
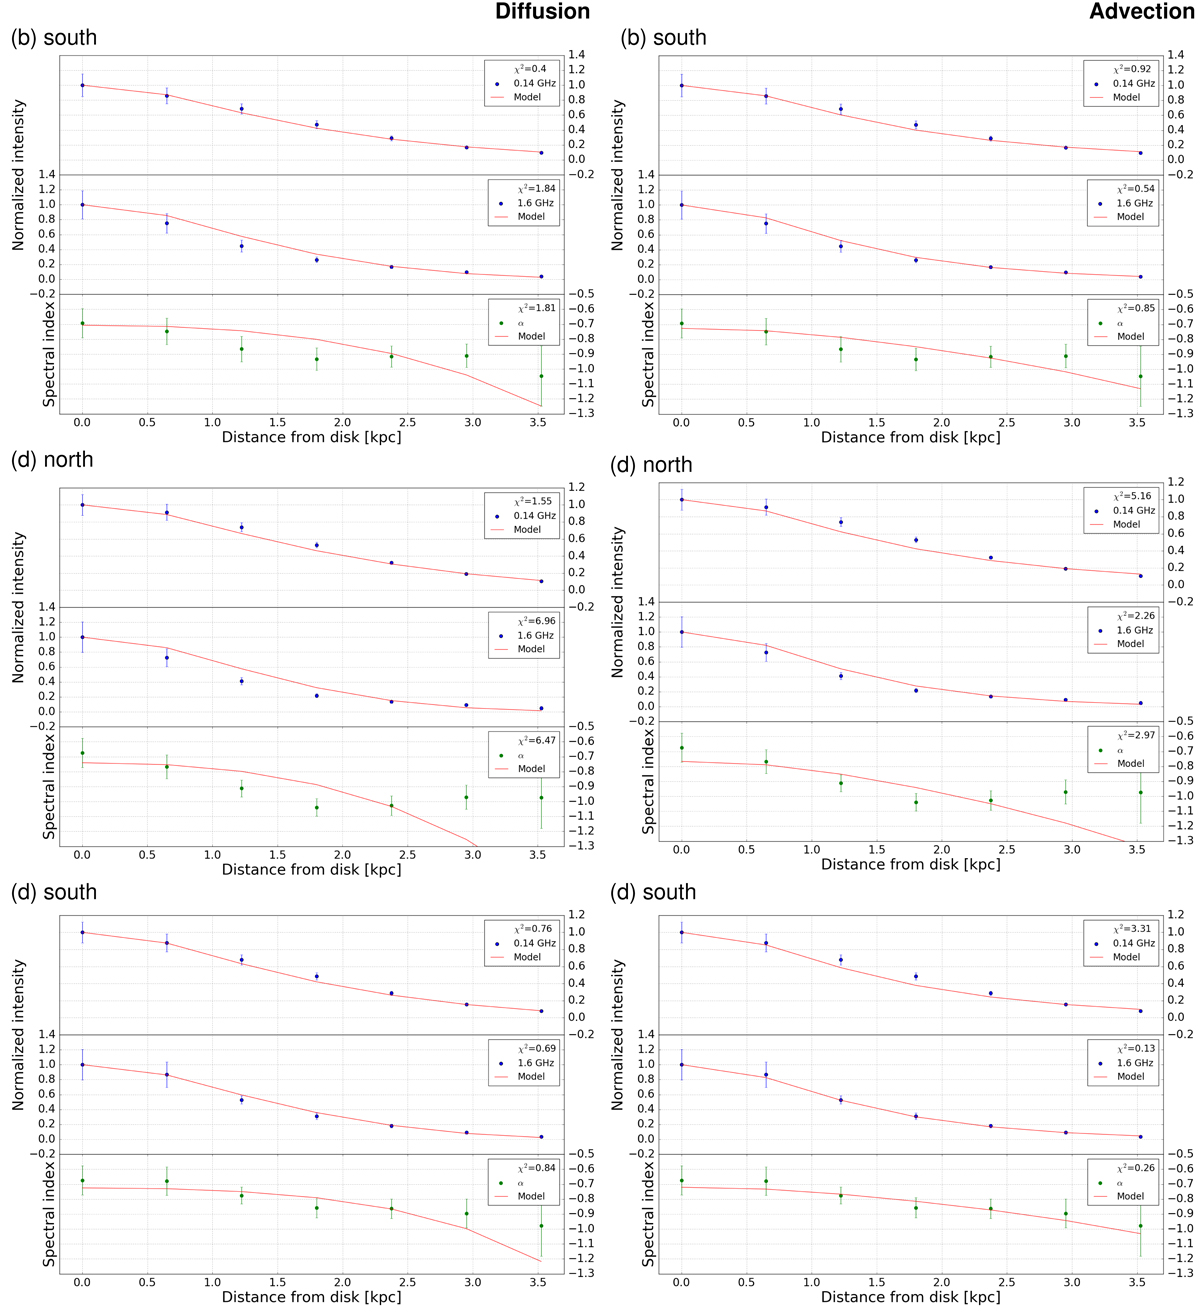
Best-fitting diffusion (left panels) and advection (right panels) models in strips b (south) and d (north and south). In each panel we show the vertical profiles. From top to bottom: 144 MHz non-thermal intensities, the 1570 MHz non-thermal intensities, and the non-thermal radio spectral index. Solid lines show the best-fitting models calculated with SPINNAKER. In each panel we also present the reduced ![]() for each observed profile and model profile.
for each observed profile and model profile.
Current usage metrics show cumulative count of Article Views (full-text article views including HTML views, PDF and ePub downloads, according to the available data) and Abstracts Views on Vision4Press platform.
Data correspond to usage on the plateform after 2015. The current usage metrics is available 48-96 hours after online publication and is updated daily on week days.
Initial download of the metrics may take a while.