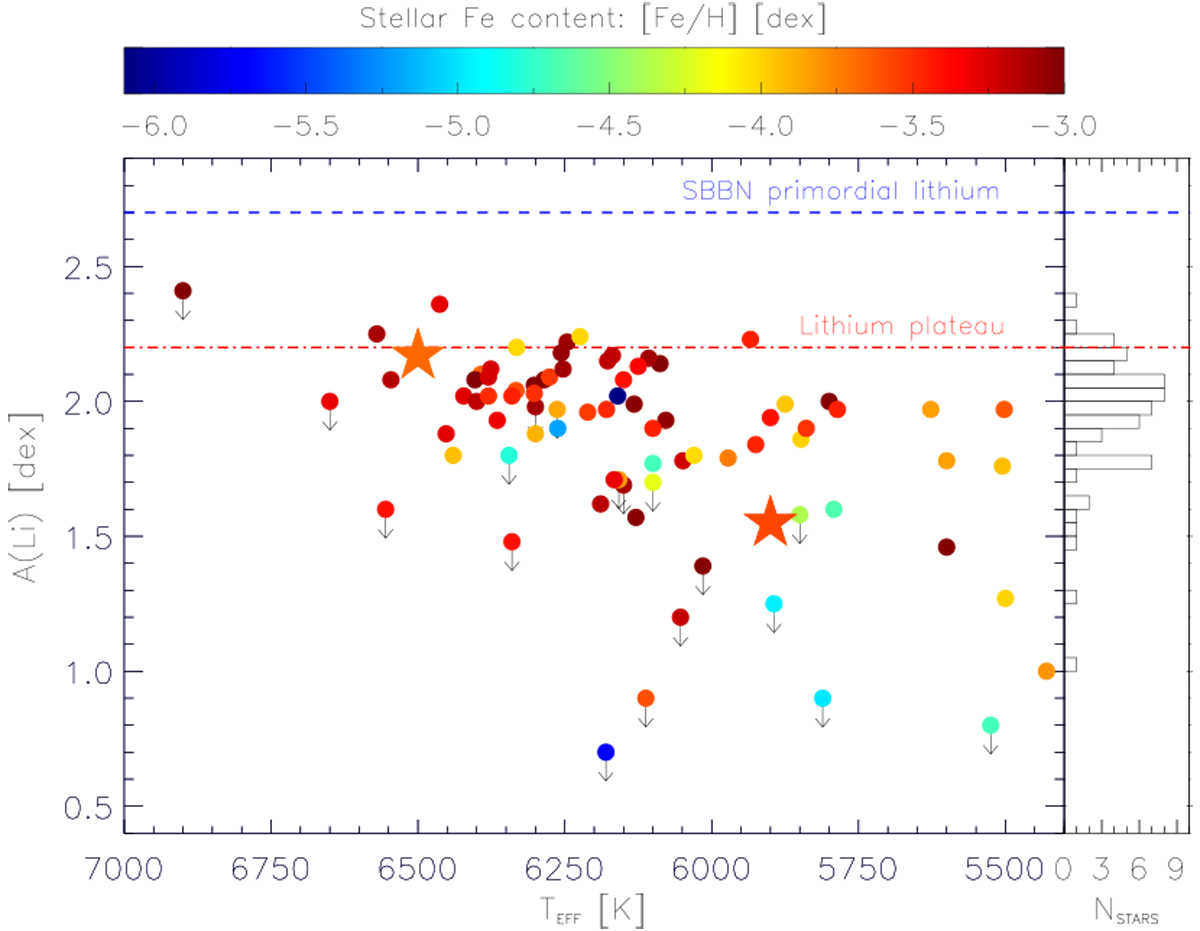
Fig. 8

Lithium abundance vs. effective temperature in CS 22876-032A and B (large stars), compared with the literature measurements (small circles) in unevolved stars with [Fe/H] < −3.0 and log g > 3.0. Downward arrows indicate upper limits. The histogram on the right side shows the Li measurements without including the upper-limit values. The blue dashed line is the predicted SBBN primordial lithium abundance and the red dash-dotted line is the value of the lithium plateau, known as the Spite Plateau.
Current usage metrics show cumulative count of Article Views (full-text article views including HTML views, PDF and ePub downloads, according to the available data) and Abstracts Views on Vision4Press platform.
Data correspond to usage on the plateform after 2015. The current usage metrics is available 48-96 hours after online publication and is updated daily on week days.
Initial download of the metrics may take a while.


