Fig. 3
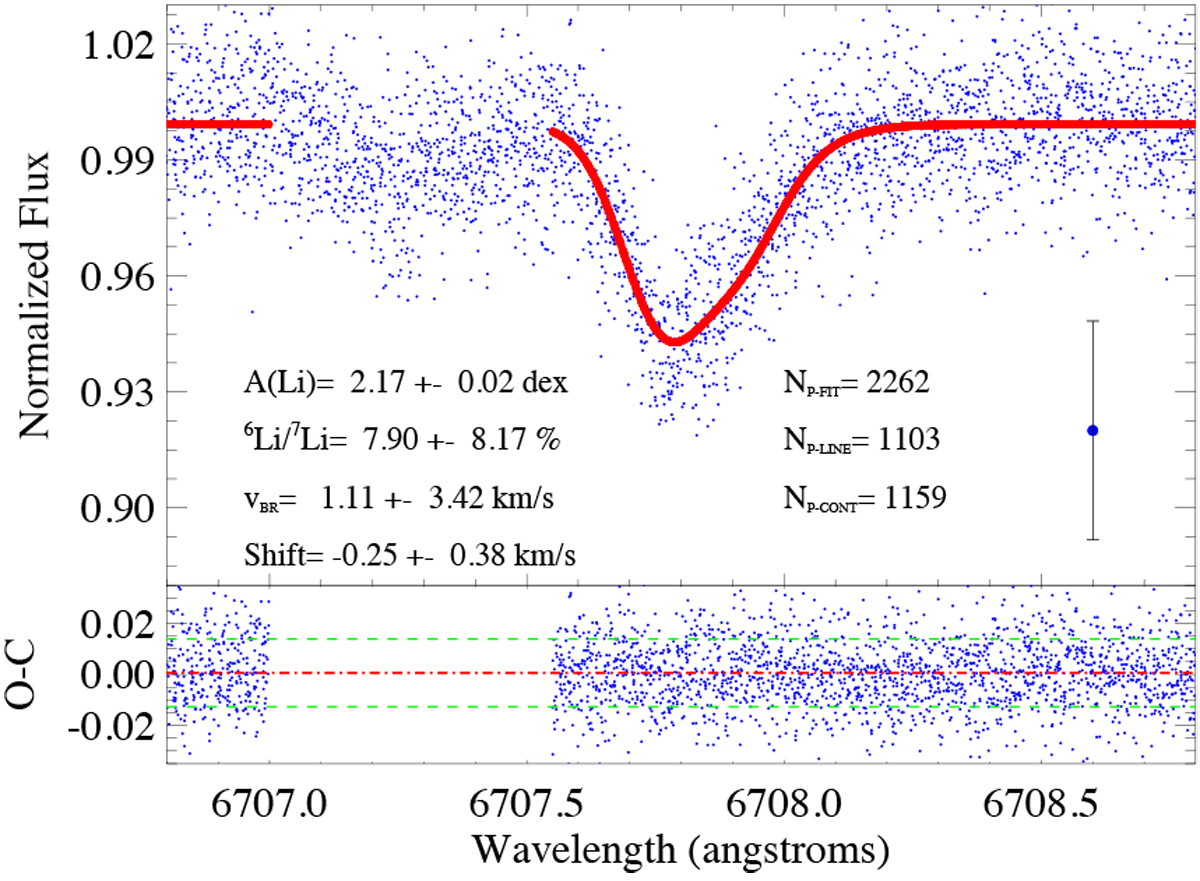
Normalised, co-added, RV-corrected, unveiled spectrum of CS 22876–032A (blue dots), together with best-fit 3D-NLTE Li profile (red circles), and residuals of the fit (lower panel). The mean flux uncertainty is shown on the right as a blue circle with error bars. The horizontal dashed and dot-dashed lines indicate the 1σ dispersion of the observed flux points relative to the mean difference observed minus computed profiles.
Current usage metrics show cumulative count of Article Views (full-text article views including HTML views, PDF and ePub downloads, according to the available data) and Abstracts Views on Vision4Press platform.
Data correspond to usage on the plateform after 2015. The current usage metrics is available 48-96 hours after online publication and is updated daily on week days.
Initial download of the metrics may take a while.