Fig. 15
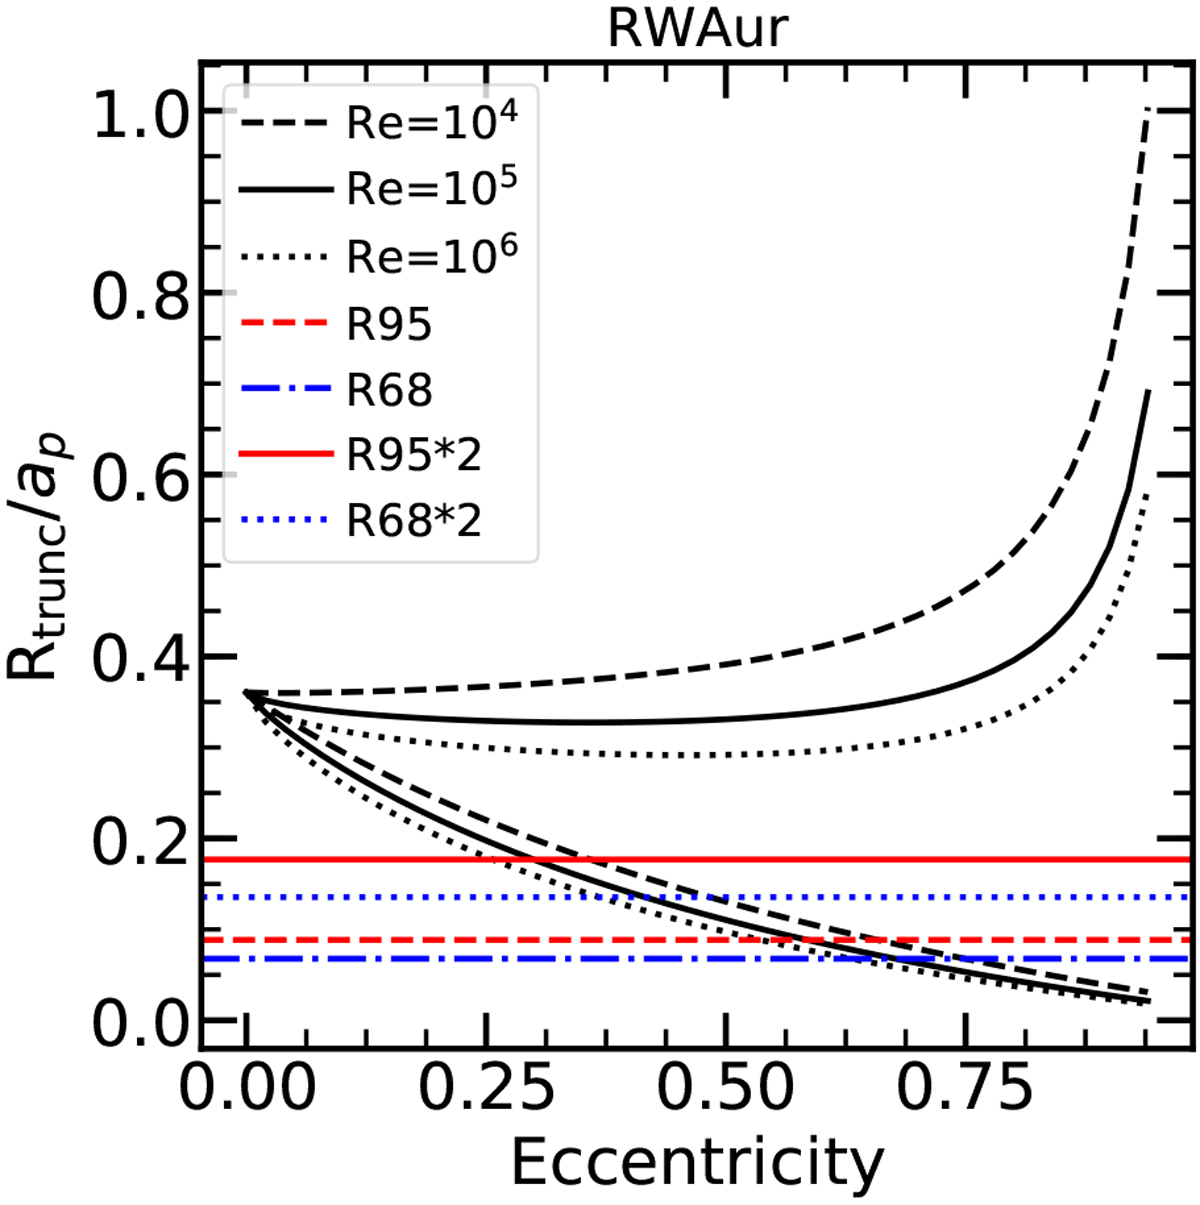
Ratio of the truncation radius to the projected separation of the orbit as a function of eccentricity assuming the parameters of the RW Aur system and orbital inclination i = 0°. The two sets of black lines are the expectations from analytic models of tidal truncation (Eq. (9)) each one calculated for three different values of ![]() (see legend). The set of three lines at the bottom is the estimate for an object observed at apoastron, the top ones at periastron. The red dashed and blue dot-dashed lines report the measured values of Rdisk,dust/ap and Reff,dust/ap for RW Aur A. respectively, while the red solid and blue dotted lines are a factor of two higher, corresponding to the assumed ratio of the gas to dust radius in the disk.
(see legend). The set of three lines at the bottom is the estimate for an object observed at apoastron, the top ones at periastron. The red dashed and blue dot-dashed lines report the measured values of Rdisk,dust/ap and Reff,dust/ap for RW Aur A. respectively, while the red solid and blue dotted lines are a factor of two higher, corresponding to the assumed ratio of the gas to dust radius in the disk.
Current usage metrics show cumulative count of Article Views (full-text article views including HTML views, PDF and ePub downloads, according to the available data) and Abstracts Views on Vision4Press platform.
Data correspond to usage on the plateform after 2015. The current usage metrics is available 48-96 hours after online publication and is updated daily on week days.
Initial download of the metrics may take a while.