Fig. 14
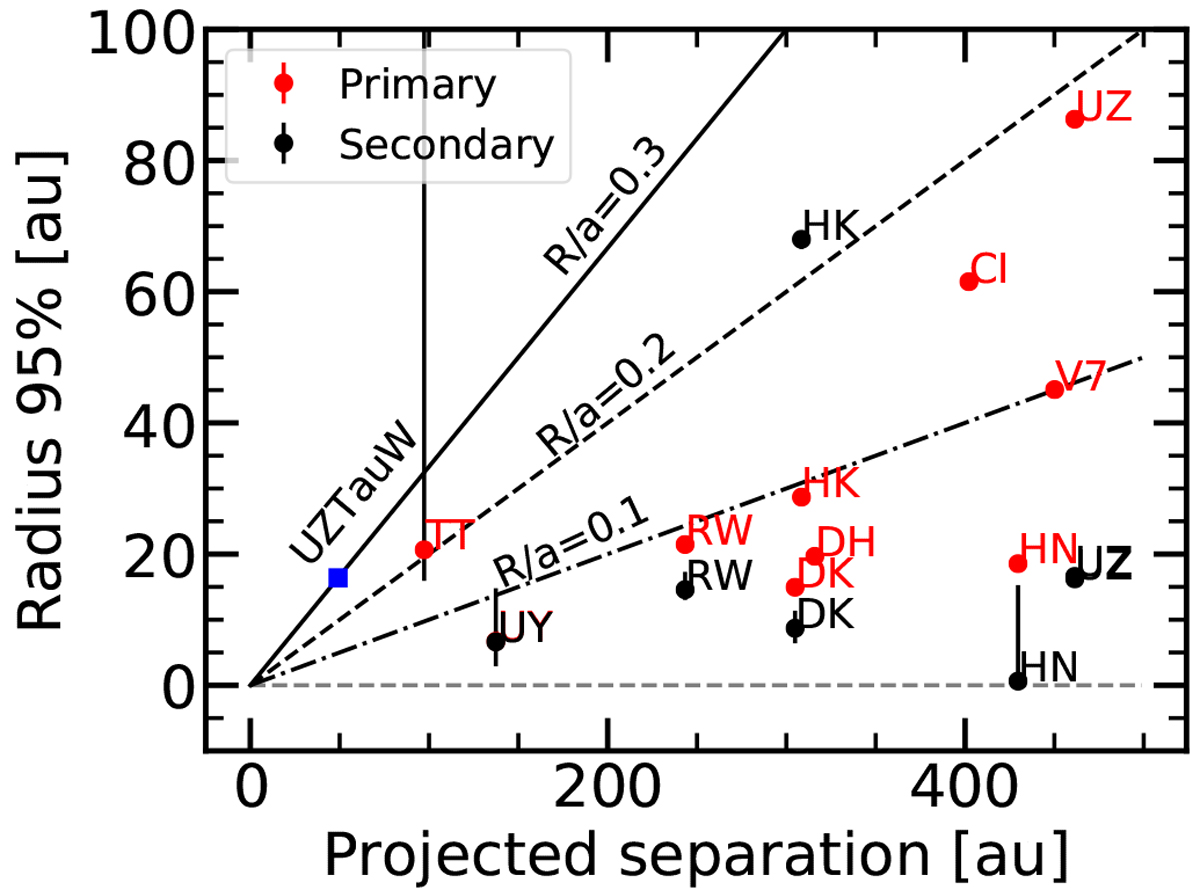
Observed separation of the components in the multiple systems vs the measured radii of the individual disks. Only the first two letters of the names are used to label the points (e.g., CI is for CIDA 9). The lines represent the ratios of radius to observed separation of 0.3 (solid line), 0.2 (dashed line), and 0.1 (dot-dashed line). TTau S is outside of the plot to the top, but the fit is uncertain. UZ Tau W represents the values for the radii of the western components of the UZ Tau system, assuming only the distance between Wa and Wb.
Current usage metrics show cumulative count of Article Views (full-text article views including HTML views, PDF and ePub downloads, according to the available data) and Abstracts Views on Vision4Press platform.
Data correspond to usage on the plateform after 2015. The current usage metrics is available 48-96 hours after online publication and is updated daily on week days.
Initial download of the metrics may take a while.