Free Access
Fig. 13
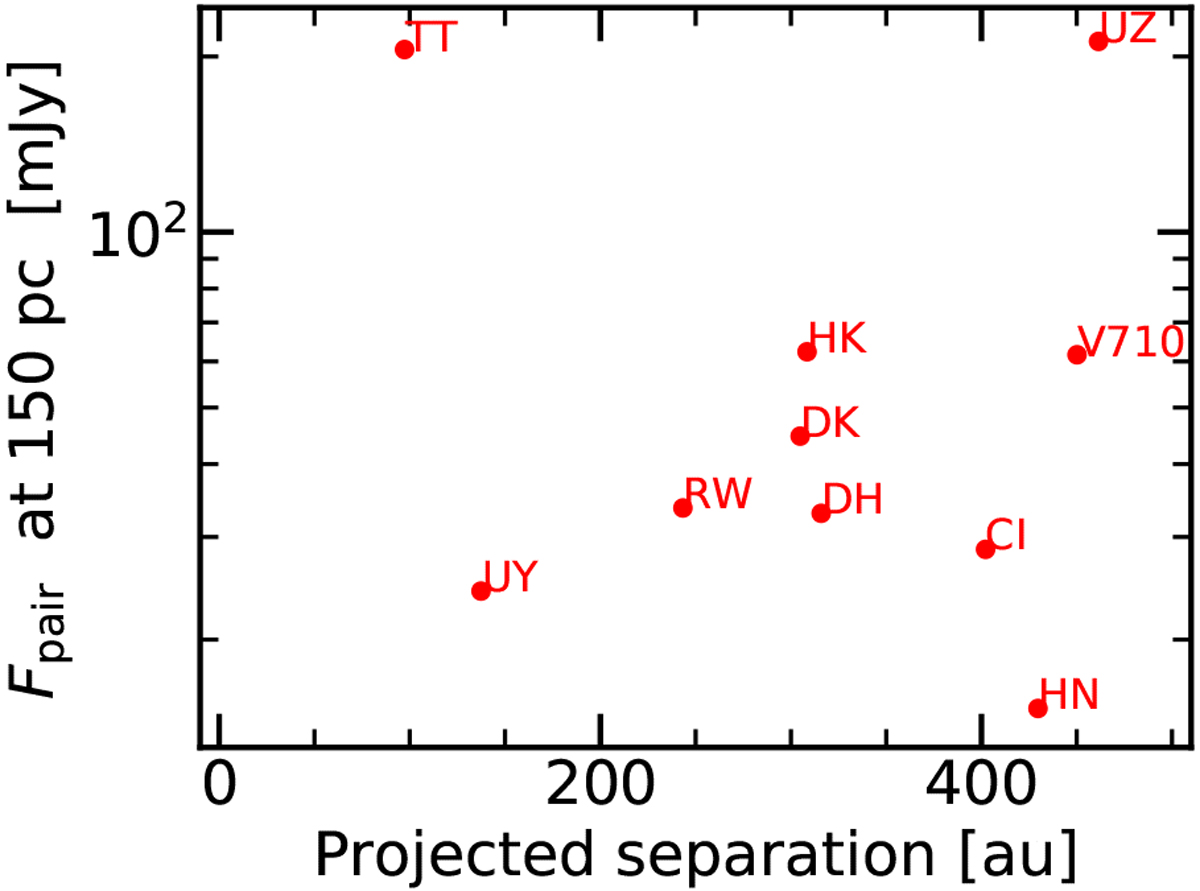
Observed separation of the components in the multiple systems vs. the sum of the rescaled measured flux densities of the individual disks. Only the first two letters of the names are shown as labels (e.g., CI is for CIDA 9).
Current usage metrics show cumulative count of Article Views (full-text article views including HTML views, PDF and ePub downloads, according to the available data) and Abstracts Views on Vision4Press platform.
Data correspond to usage on the plateform after 2015. The current usage metrics is available 48-96 hours after online publication and is updated daily on week days.
Initial download of the metrics may take a while.