Fig. 12
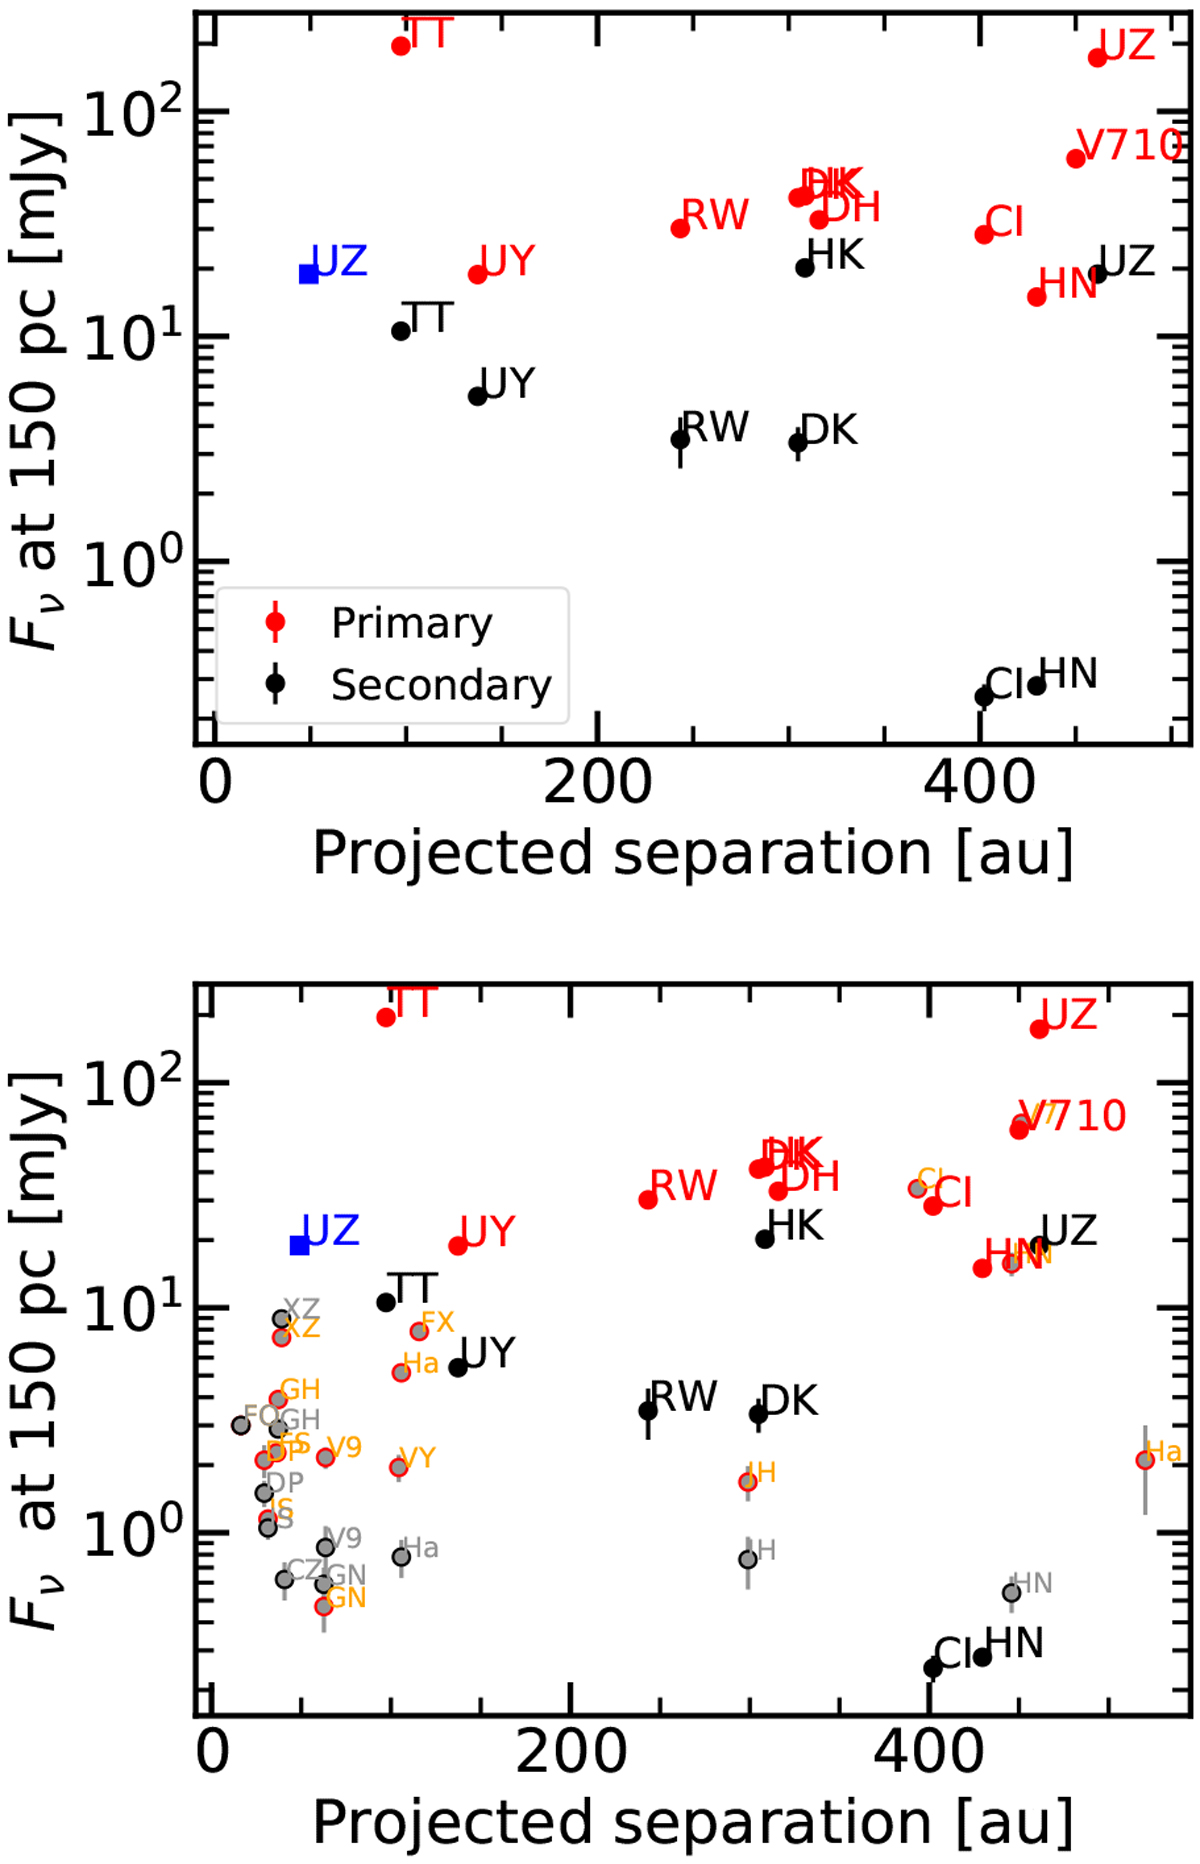
Observed separation of the components in the multiple systems vs. the measured flux densities of the individual disks. Only the first two letters of the names are shown, e.g., CI is for CIDA 9. The blue point for UZ Tau W represents the values for the flux of the western components of the UZ Tau system, assuming only the distance between Wa and Wb. Top panel: only the objects studied here, while bottom panel: targets studied by Akeson et al. (2019), reported with gray symbols with red and black edges for the primary and secondary disks, respectively.
Current usage metrics show cumulative count of Article Views (full-text article views including HTML views, PDF and ePub downloads, according to the available data) and Abstracts Views on Vision4Press platform.
Data correspond to usage on the plateform after 2015. The current usage metrics is available 48-96 hours after online publication and is updated daily on week days.
Initial download of the metrics may take a while.