Fig. 1
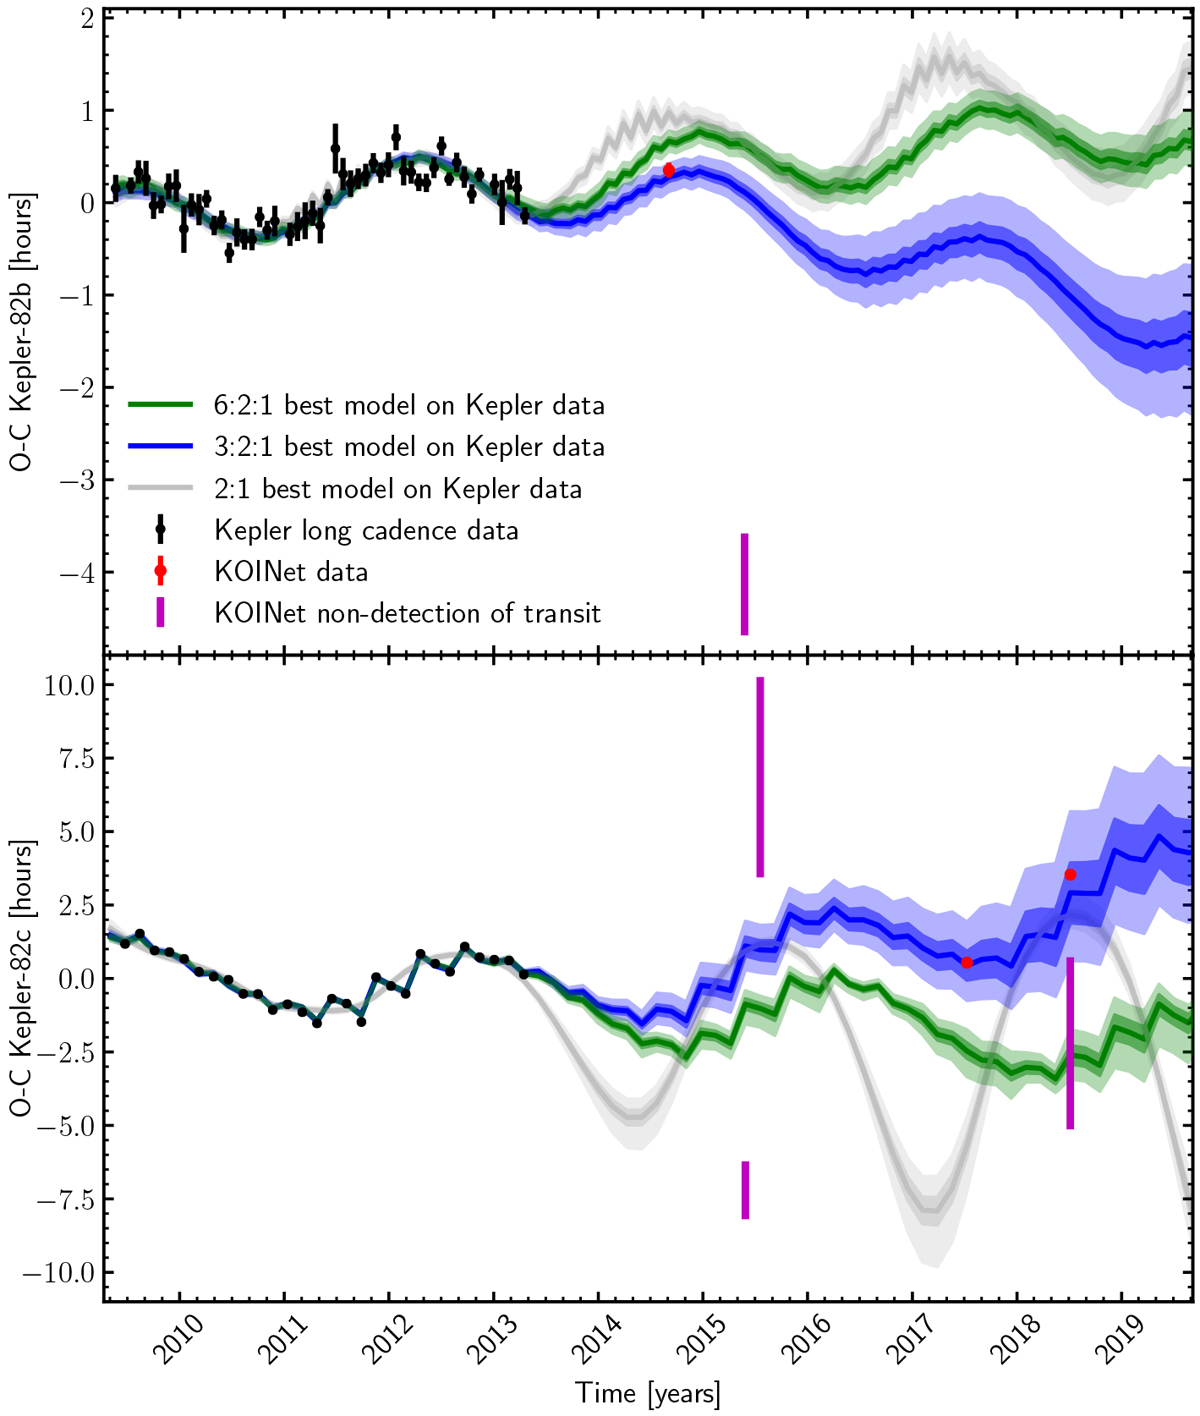
O–C diagrams of Kepler-82b at the top and Kepler-82c at the bottom with transit times from modelling the transits individually. The black points refer to the transit data from the Kepler telescope. The red points are the individual transit times from the new KOINet observations (plotted in Fig. 2). The violet lines show observed epochs but with non-detections of transit. The green area indicates the 99.7% (light) and the 68.3% (dark) confidence interval of the 6:2:1 resonance model optimised on Kepler long- and short-cadence data only, derived from 1000 randomly chosen models out of the MCMC posterior distribution; the green line is the median. The blue areas indicate the 3:2:1 resonance model solution. The grey areas present the 2:1 resonance model.
Current usage metrics show cumulative count of Article Views (full-text article views including HTML views, PDF and ePub downloads, according to the available data) and Abstracts Views on Vision4Press platform.
Data correspond to usage on the plateform after 2015. The current usage metrics is available 48-96 hours after online publication and is updated daily on week days.
Initial download of the metrics may take a while.