Free Access
Fig. 5
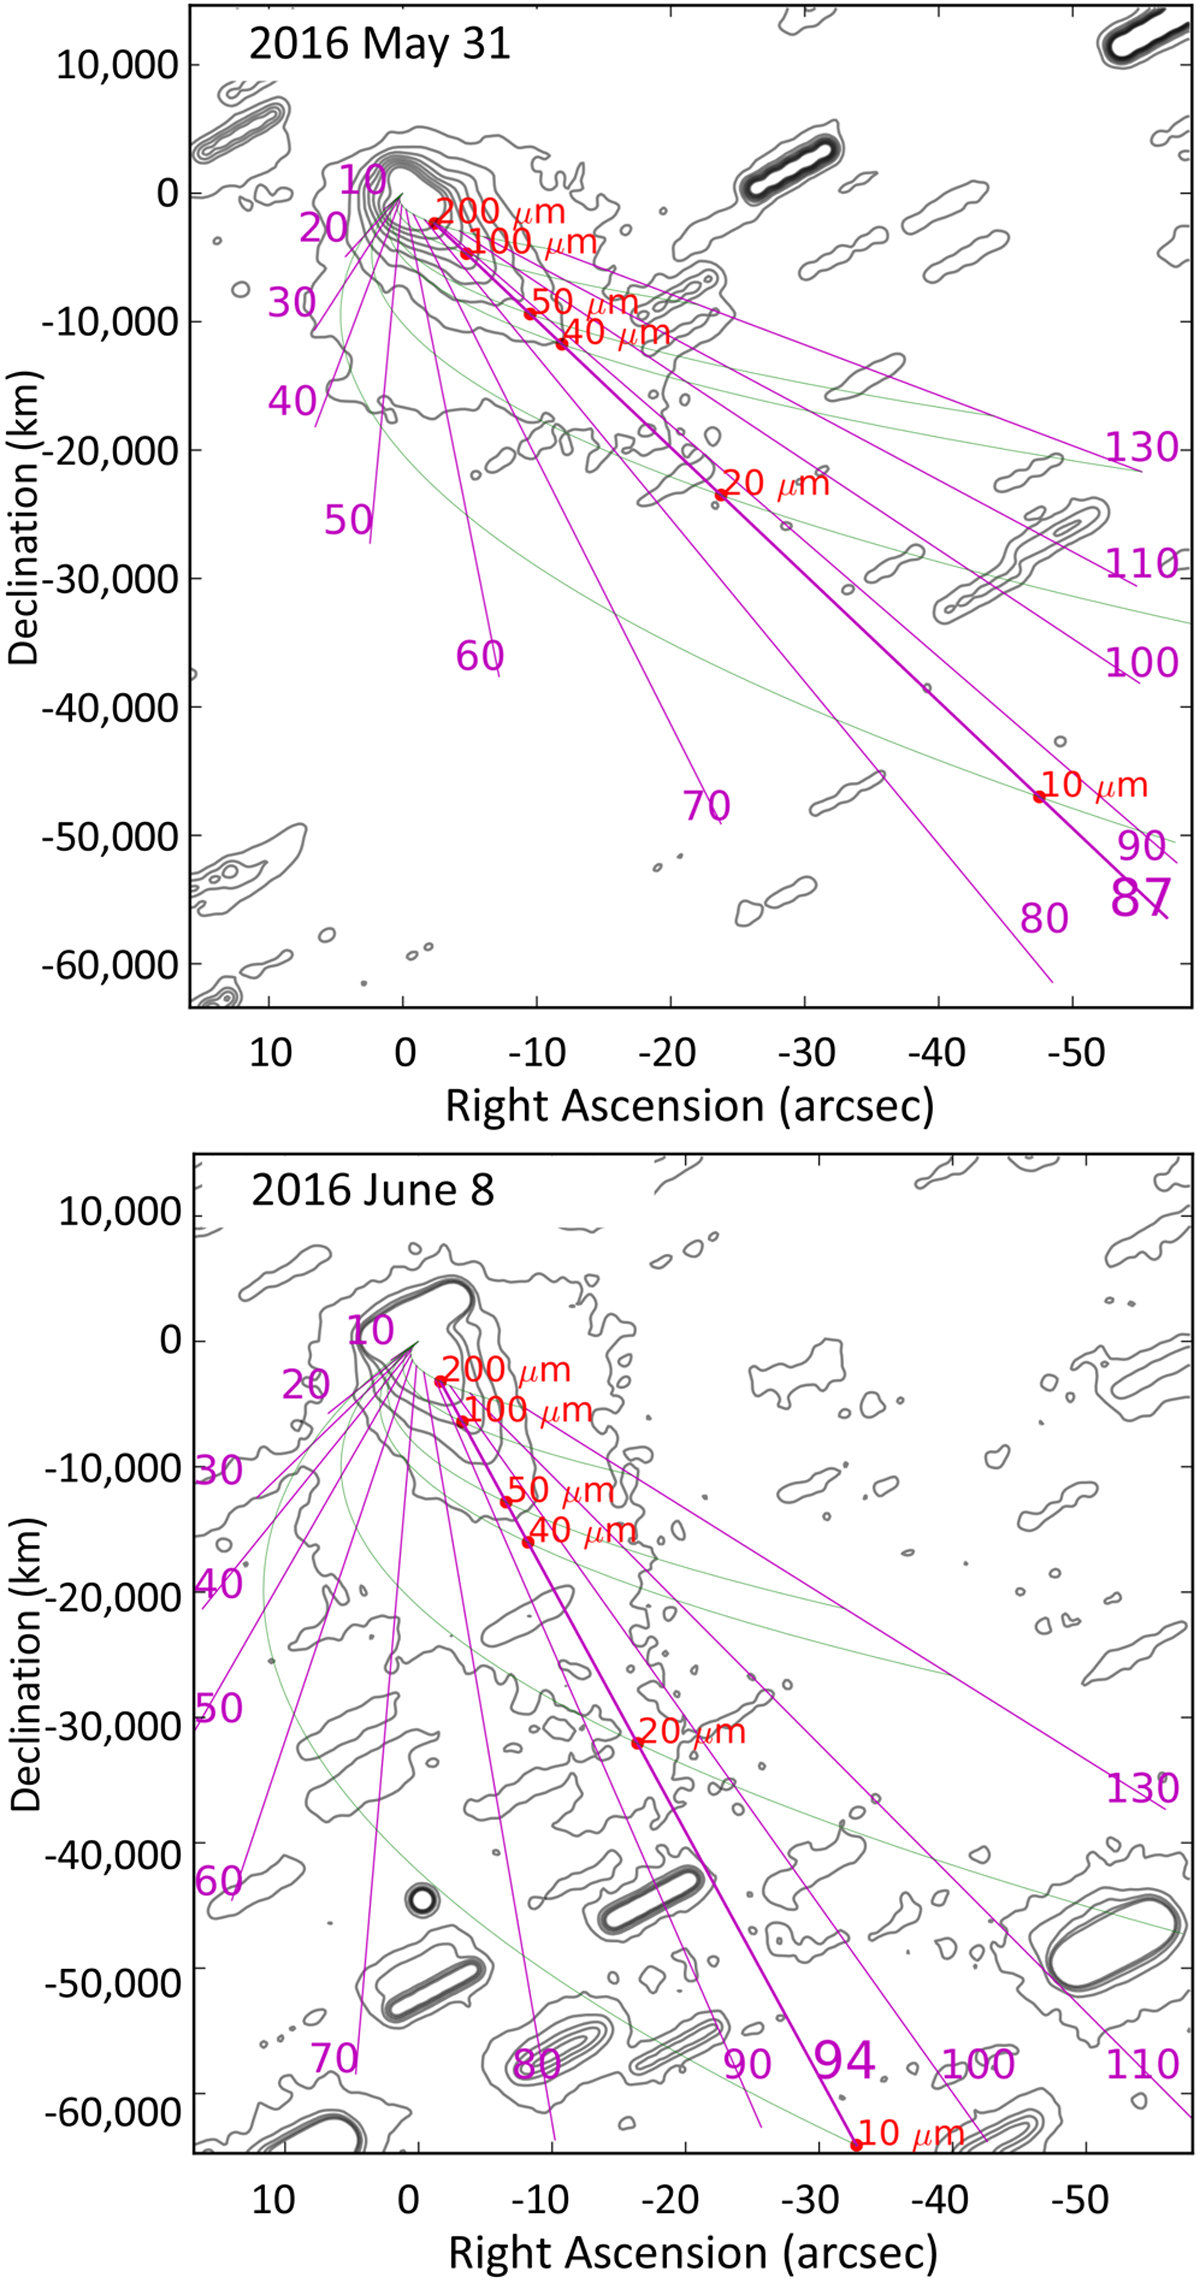
Syndynes (in green) and synchrones (in purple, labelled in days before the observation date) for P/2016 G1 on 2016 May 31 and 2016 June 8. The thicker synchrone marks the brightest peak in the dust profile, and the corresponding grain radii are marked in red. This fits with the disruption taking place around March 6.
Current usage metrics show cumulative count of Article Views (full-text article views including HTML views, PDF and ePub downloads, according to the available data) and Abstracts Views on Vision4Press platform.
Data correspond to usage on the plateform after 2015. The current usage metrics is available 48-96 hours after online publication and is updated daily on week days.
Initial download of the metrics may take a while.