Fig. 1.
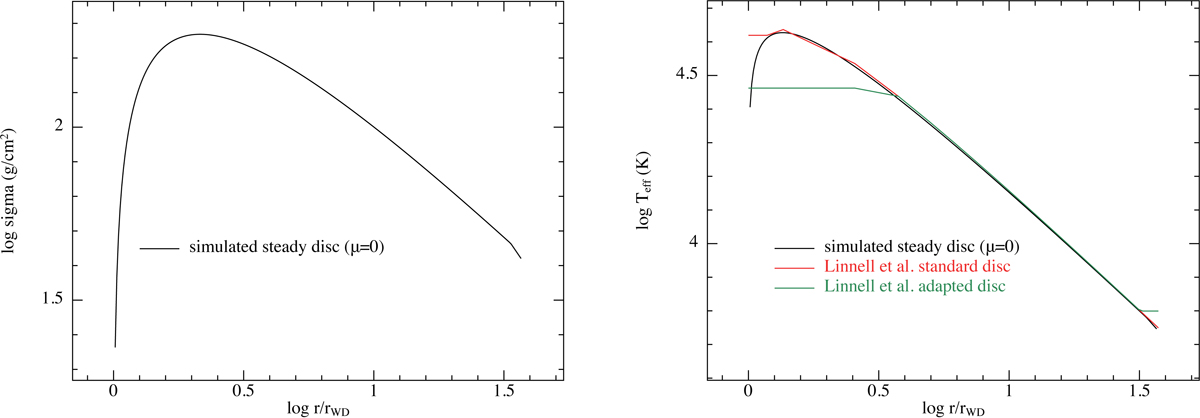
Standard disc structure before the inclusion of the MCZ effects. Left hand panel: surface density of the disc in g cm−2 on a log scale plotted against the radius of the disc in units of the white dwarf radius. A small knee can be seen in the data at the location where mass is added to the disc at 0.9rout. Otherwise the plot shows the expected power-law with an inner edge turnover. Right hand panel: effective (surface) temperature profile of the disc in Kelvin. The peak temperature is approximately 42 400 K. Overlaid in a red-solid line is the standard disc temperature profile taken from Table 8 of Linnell et al. (2007b). Overlaid in a green line is the adjusted temperature model of Linnell et al. (2007b) which is isothermal inside a radius of r/rWD = 2.56.
Current usage metrics show cumulative count of Article Views (full-text article views including HTML views, PDF and ePub downloads, according to the available data) and Abstracts Views on Vision4Press platform.
Data correspond to usage on the plateform after 2015. The current usage metrics is available 48-96 hours after online publication and is updated daily on week days.
Initial download of the metrics may take a while.