Fig. 7.
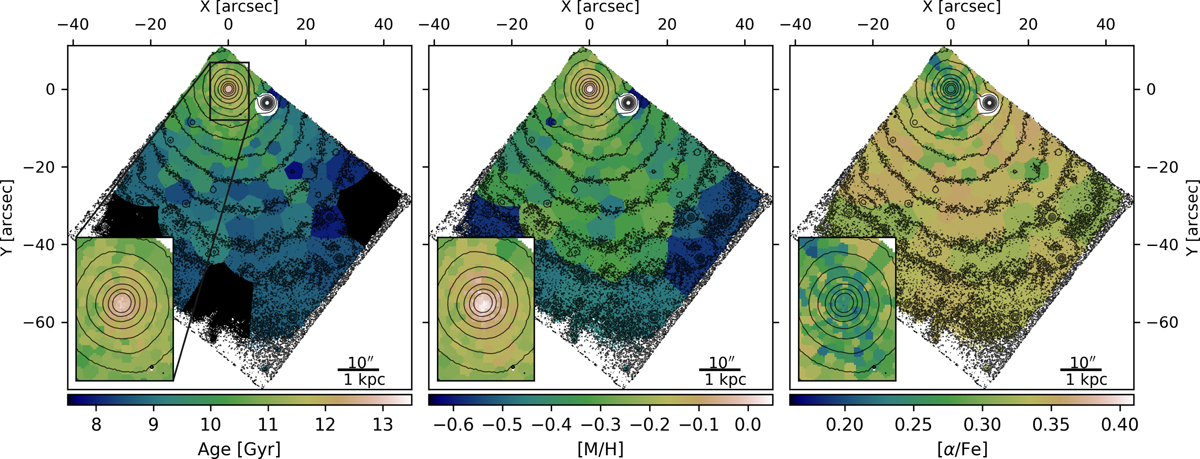
Stellar population maps of FCC 47. Mean ages (left), metallicities [M/H] (middle) and [α/Fe] abundance ratios (right) as determined from a full spectrum fit with PPXF using the alpha-variable MILES template spectra. The maps are mass weighted. We show the same isophotes as in Fig. 1. The inset shows a zoom to the central region and the innermost isophote contour corresponds to the size of the NSC (Reff = 0.7″).
Current usage metrics show cumulative count of Article Views (full-text article views including HTML views, PDF and ePub downloads, according to the available data) and Abstracts Views on Vision4Press platform.
Data correspond to usage on the plateform after 2015. The current usage metrics is available 48-96 hours after online publication and is updated daily on week days.
Initial download of the metrics may take a while.