Fig. 4.
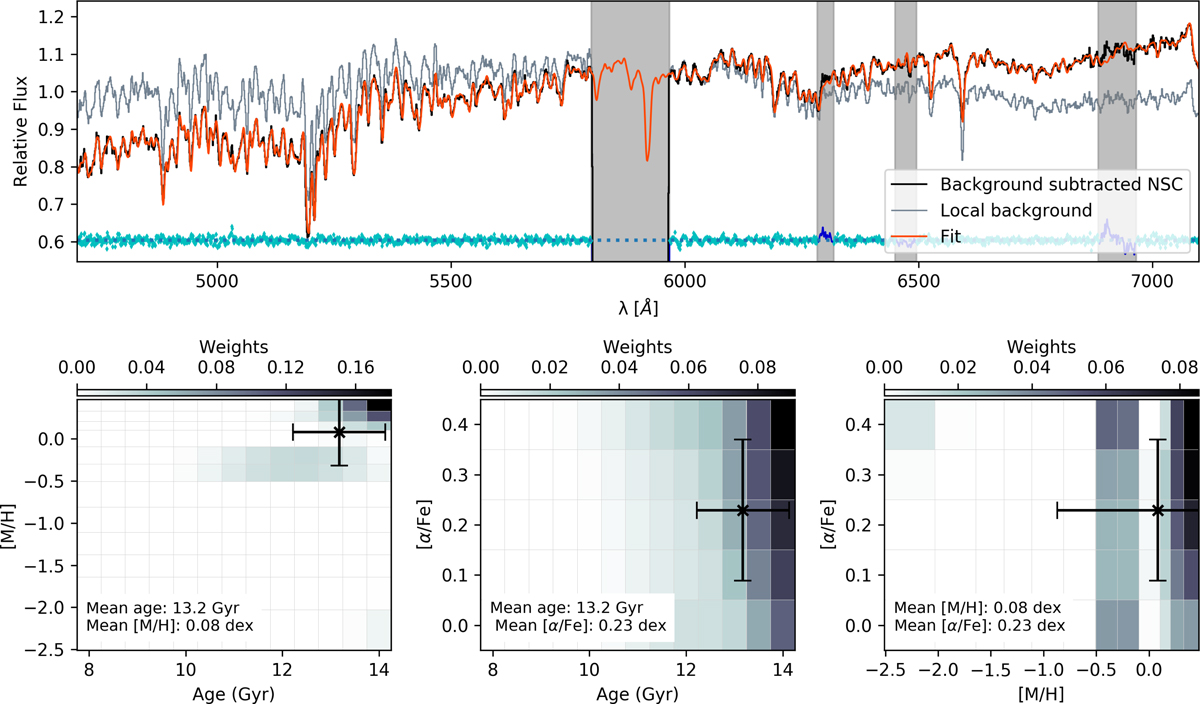
PPXF fit to the background subtracted NSC spectrum. Top: original normalised spectrum is shown in black, the best-fit spectrum in red. For comparison, the spectrum of the local galaxy background is shown in grey. The residual is shown in blue, shifted to 0.6 for visualisation. Masked regions appear as grey shaded. We masked strong sky line residuals as well as the empty region around the sodium D line that is filtered out due to the AO lasers. Bottom: weight maps illustrating the age – metallicity (left), age – [α/Fe] (middle) and [α/Fe] – metallicity (right) grids. The weight of each template used in the fit is given by the greyscale. The black cross shows the weighted mean age, metallicity and α-element abundance with errorbars. The weight maps are normalised. A regularisation parameter of 30 was used in this fit.
Current usage metrics show cumulative count of Article Views (full-text article views including HTML views, PDF and ePub downloads, according to the available data) and Abstracts Views on Vision4Press platform.
Data correspond to usage on the plateform after 2015. The current usage metrics is available 48-96 hours after online publication and is updated daily on week days.
Initial download of the metrics may take a while.