Fig. A.1.
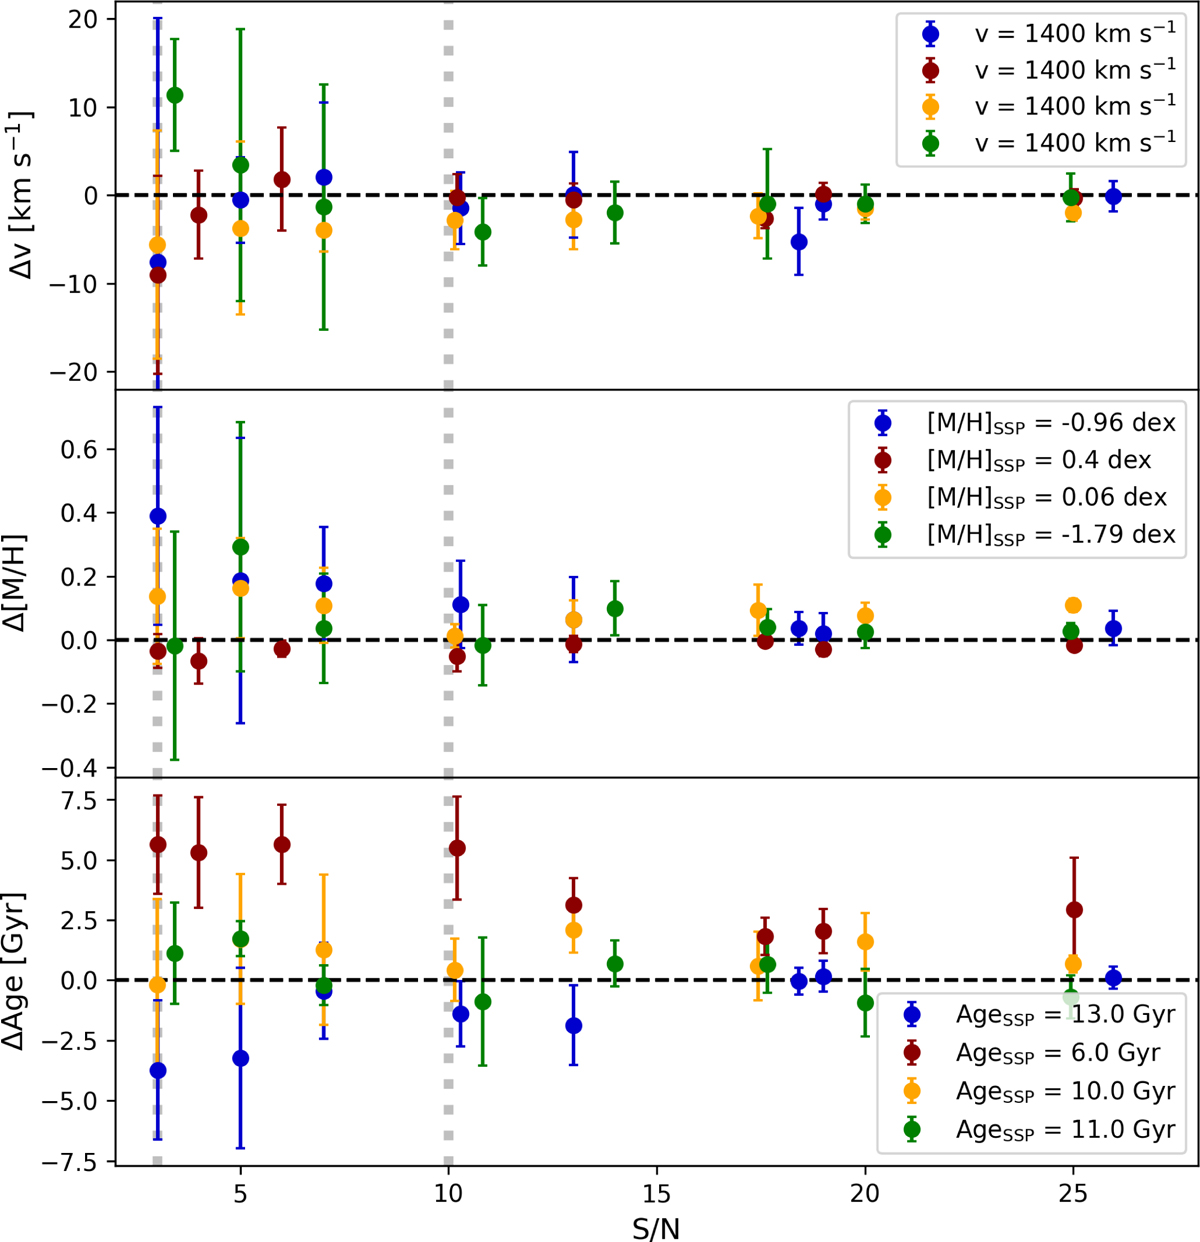
Recovery of SSP input parameters with PPXF versus S/N of the spectrum. We use four different SSP templates (as indicated by different colours) from the E-MILES library and add artificially Gaussian noise. The noisy spectrum is then fitted with PPXF. For each S/N, we repeat this with five noisy spectra and show the difference between the input parameter and the mean values of these five trails and their standard deviation. The vertical lines indicate the threshold S/N values of ten and three that we chose for reliable measurements of metallicities and velocities, respectively.
Current usage metrics show cumulative count of Article Views (full-text article views including HTML views, PDF and ePub downloads, according to the available data) and Abstracts Views on Vision4Press platform.
Data correspond to usage on the plateform after 2015. The current usage metrics is available 48-96 hours after online publication and is updated daily on week days.
Initial download of the metrics may take a while.