Fig. 14.
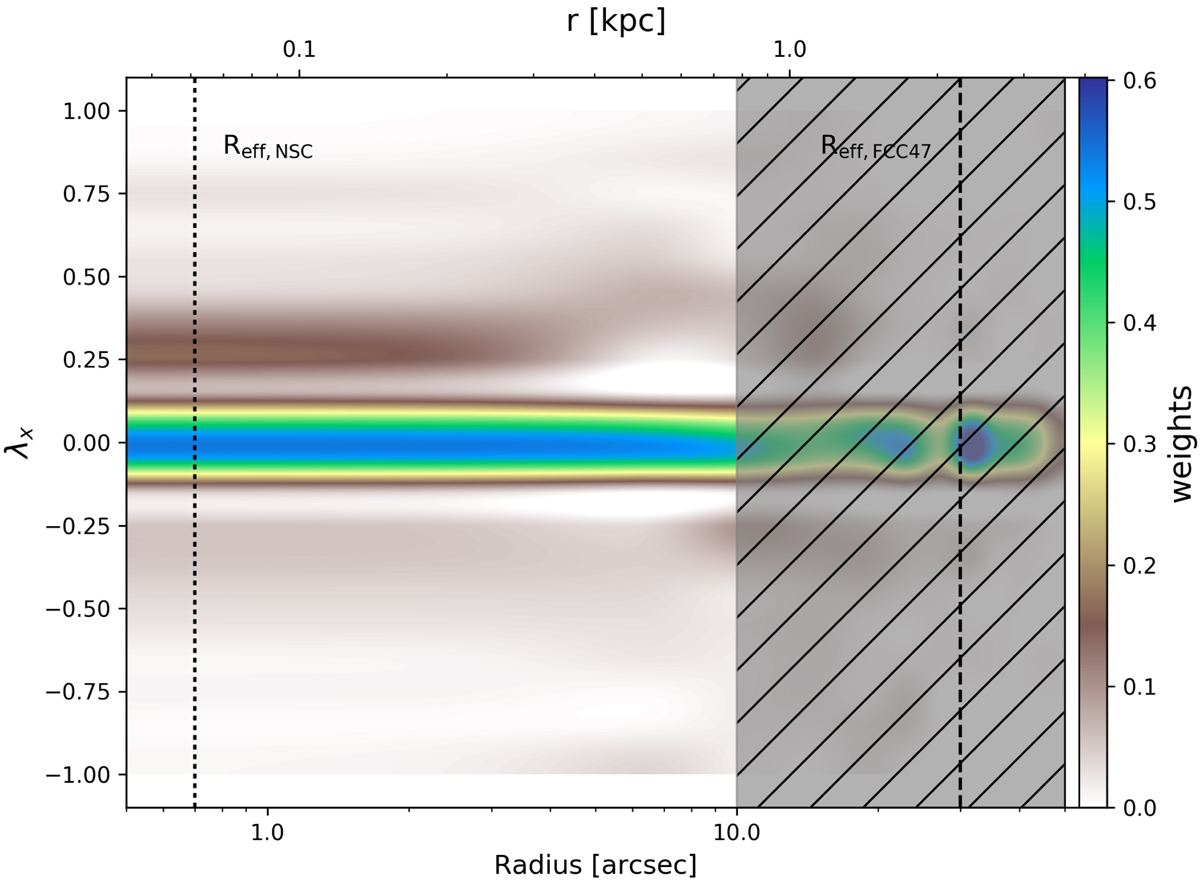
Distribution of orbital weights along long axis of the mean of the five best-fitting models. The dotted lines show the effective radius of the NSC (Reff, NSC = 0.7″, Turner et al. 2012) and FCC 47 (Reff, FCC 47 = 30″, Ferguson 1989). The shaded area shows the region where we lack coverage with the MUSE data along the short axis.
Current usage metrics show cumulative count of Article Views (full-text article views including HTML views, PDF and ePub downloads, according to the available data) and Abstracts Views on Vision4Press platform.
Data correspond to usage on the plateform after 2015. The current usage metrics is available 48-96 hours after online publication and is updated daily on week days.
Initial download of the metrics may take a while.